
Synthetix extended deposit rewards for sUSD on Infinex through November 7, 2025, keeping incentives live as the team readies its mainnet derivatives push. The update landed today with a clear timeline and unchanged eligibility rules. It keeps the current campaign running across the next six weeks.
The official X post repeated the core details and pointed users to weekly OP distributions and on-chain raffle prizes tied to qualifying sUSD balances. The message aligned with the blog guidance and confirmed the new end date.
The extension arrives as Synthetix concentrates liquidity and product activity on Ethereum mainnet. Consequently, the rewards program remains a bridge between today’s deposit flow and the upcoming perps rollout.
What rewards include
According to today’s posts, eligible depositors share weekly OP token emissions. In addition, they receive entries for on-chain raffles that can award items such as Infinex Patron NFTs, ETH, and SNX. The channel emphasized that both mechanics continue during the extended window.

The program runs natively on Infinex with rewards and prize logic executed on-chain. That design provides transparent distribution and clear cutoffs tied to the campaign dates.
Because prior rounds used the same framework, contributors can compare accrual patterns across months and track how incentive levels affect deposit behavior. Synthetix has used these iterations to keep parameters predictable while it shifts architecture.
Why it matters now
Synthetix is preparing the first perps exchange on Ethereum mainnet, with public materials pointing to a Q4 launch. Extending sUSD rewards helps keep settlement liquidity available as the product stack moves from testing to production.
The campaign also supports sUSD’s role inside the ecosystem after months of peg-recovery work and protocol changes. Keeping deposits sticky provides smoother handoff into mainnet-focused liquidity programs.
In short, today’s change preserves momentum. It keeps user incentives aligned with Synthetix’s near-term roadmap and gives depositors a clear schedule through November 7, without altering how they participate.
Analyst flags breakout structure on SNXUSDT
An independent analyst says SNX has broken above a months-long ceiling and may be setting up a continuation move. The shared dailySNX/USDT chart shows price clearing a horizontal resistance band that capped rallies through spring and summer. A boxed zone marks that prior supply area, which now acts as first support after the breakout.
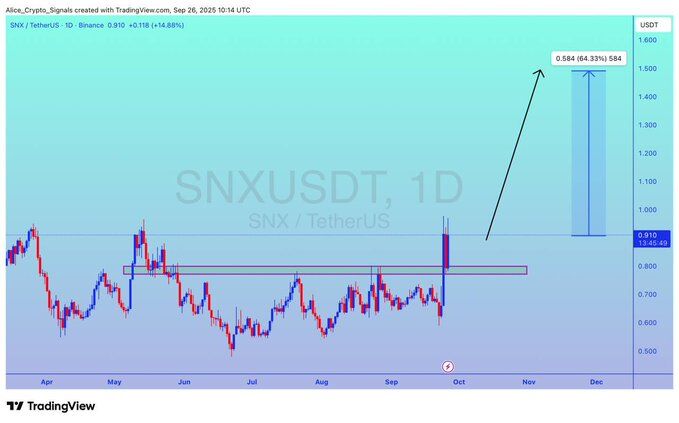
The visual outlines a clean retest scenario. Candles pushed through the band, then pulled back into the same zone, suggesting a check of new support before momentum resumes. An arrow projects follow-through toward a measured area highlighted on the right side of the chart. The annotation cites a potential move of about sixty percent from the retest to the target region.
Context matters for this read. The structure compresses months of range trading into a single breakout and retest sequence on the one-day timeframe. Therefore, the thesis depends on that reclaimed band holding on closing bases. If it does, the pattern implies continuation; if it fails, the breakout loses confirmation. The post frames the setup as preparation for a “bullish wave,” while the chart itself anchors the claim in a break-retest-extend model rather than intraday volatility.
Analyst maps cup base and EMA cross on SNX
The chart presents a nine-month “cup” structure that arcs from winter into late September. Price now sits near the lip of that base, where prior rallies failed around the 0.98–1.08 band. The drawing then projects a breakout, a brief pullback to the lip, and an extension toward the 2.03–2.30 zone, marked as roughly +120% from the base.
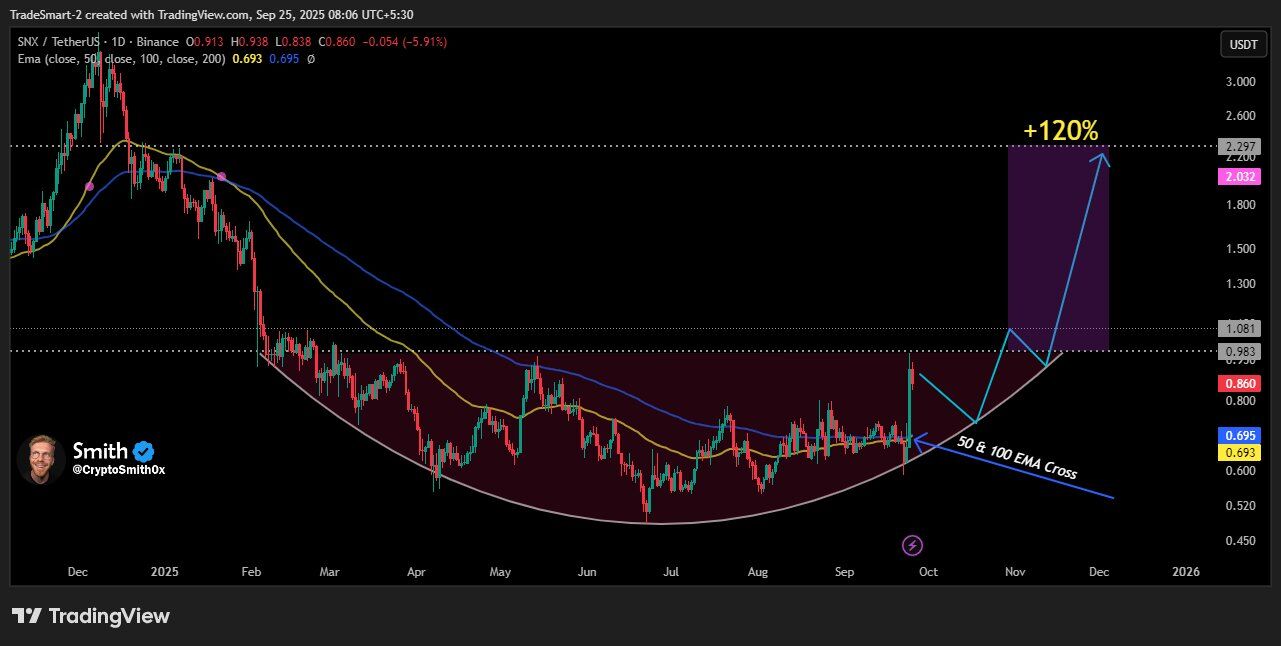
Moving averages reinforce the bullish read. The overlay highlights a 50/100 EMA bullish cross emerging as price pushes through the base’s neckline. In trend systems, that cross usually signals improving momentum and shrinking downside tails. Here, it lines up with the cup’s right rim, so both pattern and EMAs point to the same inflection.
However, the path shown depends on holds at key levels. The sketch expects a retest of the neckline after breakout; if closes stay above that band, the cup logic remains intact. If price loses the neckline and falls back under the newly crossed EMAs, the setup weakens and the cup completion delays. In short, the illustration ties the upside to confirming closes above the lip and to EMAs that continue to curl upward.
MACD momentum flips decisively positive on SNX
SNX’s MACD just delivered a strong bullish sequence. The MACD line (≈0.065) crossed above the signal line (≈0.044) and shot through the zero line, while the histogram printed tall green bars (≈0.021). This stack—bullish cross, zero-line reclaim, and expanding histogram—signals accelerating upside momentum rather than a routine bounce.
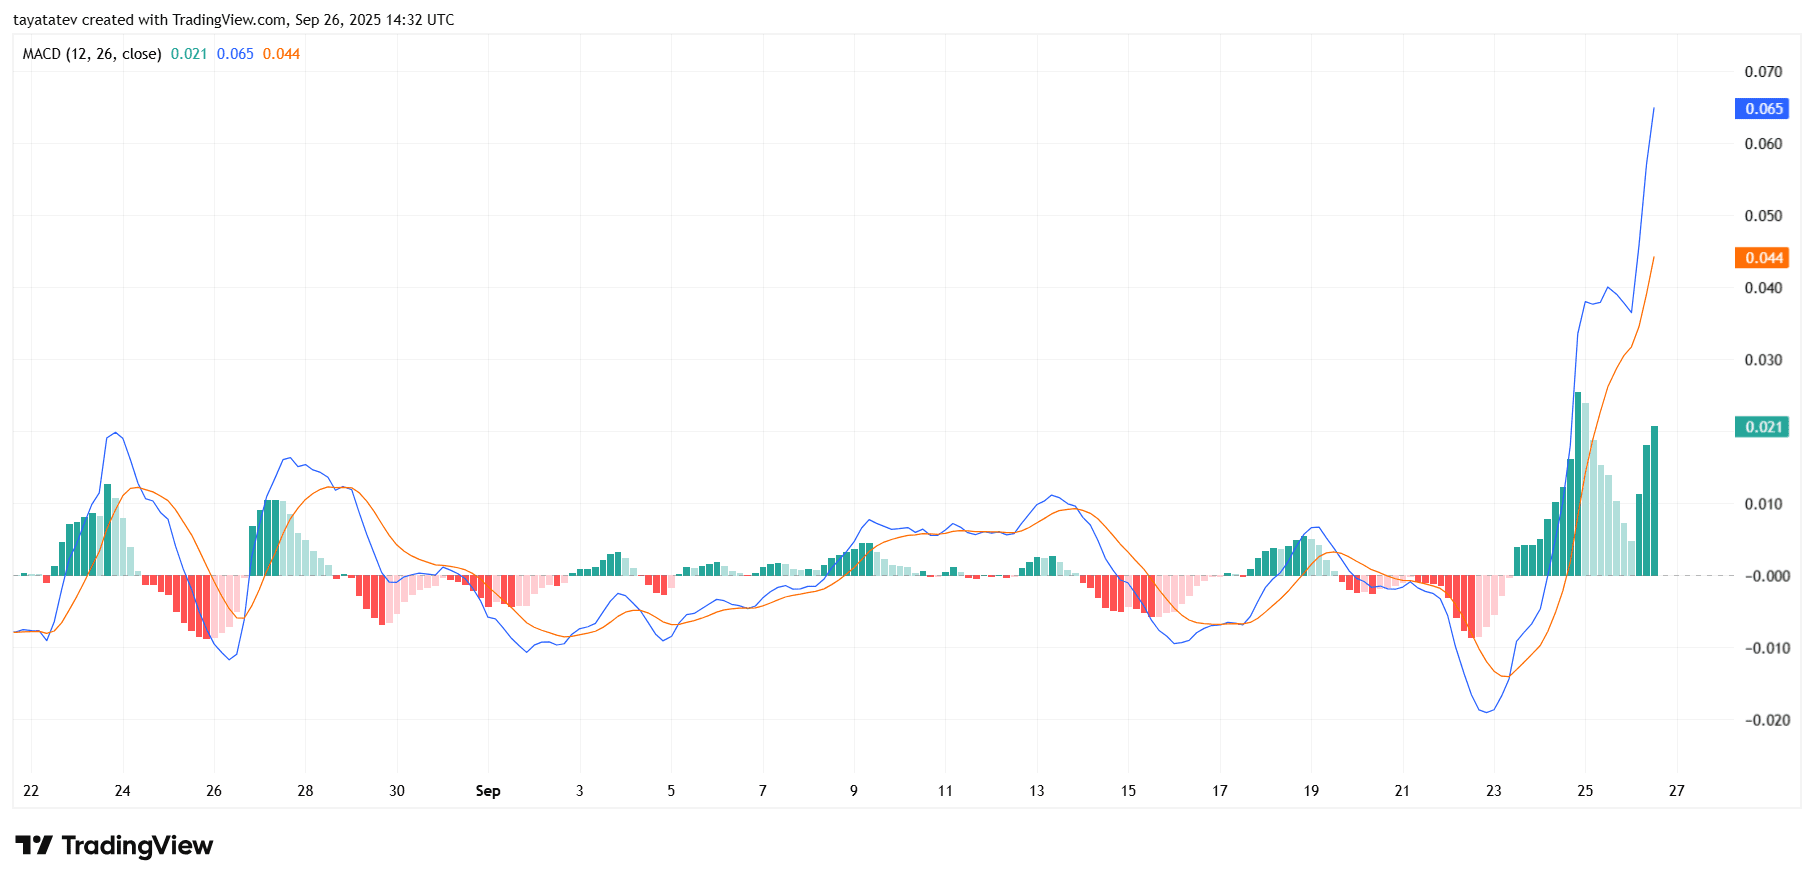
Recent behavior strengthens the read. Momentum stayed negative into Sept. 23, then flipped as the MACD line curved up sharply and the signal lagged behind. Because MACD is a smoothed measure, such a vertical turn usually reflects a broad pickup across multiple candles, not only one spike. The gap between the MACD and signal lines also widened, which often sustains momentum until the signal catches up.
However, the panel now shows early signs to monitor. The latest green bar is smaller than the prior peak, which hints at initial deceleration even as momentum remains positive. If the histogram continues making higher lows above zero while the lines stay crossed, trend strength holds. If the histogram shrinks toward zero and the lines converge, momentum is cooling and a mean reversion becomes more likely. In short, bulls control the tape for now, but follow-through needs persistent positive histogram prints and a maintained MACD-over-signal posture.