
Shiba Inu (SHIB) is once again showing signs of life. An analyst has spotted a parabolic pattern forming on the charts — a structure that, in the past, has often preceded strong upward moves. But can the same pattern repeat this time? Read on for a SHIB analysis.
Analyst Sees a Parabolic Setup Forming
Analyst ShibSpain believes Shiba Inu is building a parabolic setup similar to the one that fueled its previous rallies.
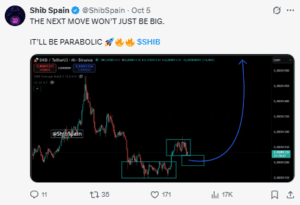
In this pattern, prices flatten out near the bottom as selling pressure weakens, then gradually curve upward as buyers return. According to ShibSpain, the curve forming on SHIB’s current chart looks almost identical to those seen before earlier breakouts in 2021 and 2023.
He explained that this kind of formation usually shows steady accumulation, where long-term holders quietly buy while short-term traders lose interest. Once enough demand builds, prices can accelerate sharply — but such moves often depend on broader market momentum.
ShibSpain noted that SHIB has already shown early signs of recovery from its base near $0.0000118, though it still trades below key resistance. In his view, a sustained move above $0.0000135 could complete the curve and start the acceleration phase of the pattern.
However, parabolic structures are fragile. If buying momentum fades or the wider crypto market weakens, the setup could collapse before it completes.
SHIB Tests Resistance Amid Parabolic Setup
In contrast, another analyst with X username ‘CW’ has identified a heavy sell wall near $0.0000155, which he believes could be the next big test for SHIB. His chart shows SHIB approaching this zone after bouncing several times from the $0.0000118–$0.0000120 support region. He notes that each rebound has been slightly stronger, suggesting some accumulation beneath the surface.
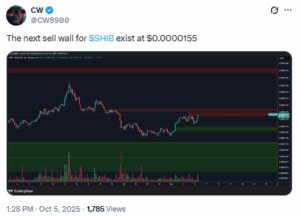
However, the analyst also points out that SHIB remains below its descending trendline, which has acted as resistance since mid-2024. Until the token breaks and closes above that trendline, CW considers the overall setup neutral.
In his view, a decisive close above $0.0000135 could open a path toward the $0.0000155 resistance. But without stronger volume, any breakout could fail quickly.
SHIB On-Chain Activity Shows Flat Burn Rate and Declining Liquidity
On-chain data shows tha the total value locked (TVL) in Shibarium-based DeFi protocols currently stands at $949,950, down 1.34% in the past 24 hours.
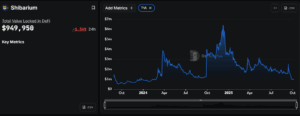
This figure is considerably lower than earlier highs seen months ago, suggesting that liquidity and user activity in the ecosystem remain limited. A higher TVL would typically indicate stronger engagement and greater confidence in the network, but current data points to subdued participation.
Additionally, Shiba Inu’s burn rate has dropped by 13.85% in the past 24 hours, with only about 4.17 million SHIB removed from circulation.
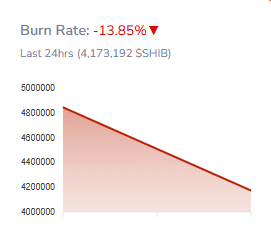
While token burning helps reduce supply over time, the current scale of daily burns remains too small to influence price dynamics meaningfully. The total circulating supply is still around 584.7 trillion SHIB, making supply reduction a slow process.
This means short-term price movements are likely driven more by trading sentiment and technical patterns rather than by deflationary impact.
Can the Parabolic Setup Trigger a Rally?
SHIB to USD has traded above its 20-day moving average for several sessions, showing mild short-term strength. However, the token remains below the 50-day EMA ($0.0000137) and the 200-day EMA ($0.0000150) — both critical resistance levels that need to be cleared to reverse the downtrend.
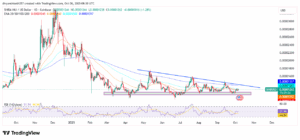
The current chart shows narrowing daily ranges and consistent higher lows, forming the base of the parabolic curve. Still, RSI readings and muted volume indicate that the move lacks momentum.
In past rallies, RSI values climbed above 70 and volume doubled. Those signals have yet to appear, keeping SHIB in accumulation mode. A daily close above $0.0000135 with trading volume at least 30–40% higher than average would mark the first confirmed breakout.
If SHIB price closes above $0.0000135 with strong volume, the price could rise toward $0.0000155. This would be in line with ShibSpain’s upper projection. Sustained buying could extend the move to around $0.0000162, where earlier rallies peaked.
If resistance holds, SHIB may continue trading between $0.0000120 and $0.0000135, maintaining the same accumulation pattern. A daily close below $0.0000118 would invalidate the parabolic curve and expose the lower support zone near $0.0000110.