
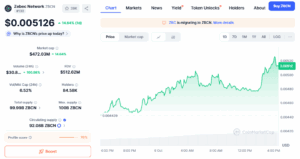
Zebec Network’s token ZBCN has jumped 14% in the past 24 hours and 39% over the week, trading near $0.00513 on Oct. 6. The rally is fueled by whale buying — if community member ZBCN-Man is to be believed. But is this claim really true? Let’s analyze what the data actually shows.
A Zebec Network community member with X username ‘ZBCNMan’ shared screenshots of several large ZBCN transfers, each showing hundreds of thousands of dollars’ worth of tokens moving between wallets.
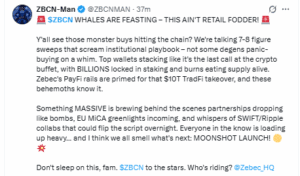
He claimed these transactions were major whale purchases, writing that “$ZBCN whales are feasting” and describing the movements as “7–8 figure sweeps” — something he said looked like institutional accumulation.
The post spread quickly among Zebec supporters. Some users took it as a bullish signal, suggesting that large investors were quietly entering ZBCN before the next phase of Zebec’s DePIN expansion. If that were true, it could mark the start of a stronger market trend for the token.
But before accepting that idea, it’s important to check what the blockchain and market data actually show.
Regulatory Tailwind Behind the ZBCN Rally
ZBCN’s latest price move aligns closely with a recent regulatory update in the U.S. On Oct. 1, the Securities and Exchange Commission (SEC) issued a “no-action” letter confirming that Decentralized Physical Infrastructure Network (DePIN) tokens are not securities.
The clarification, supported by Commissioner Hester Peirce, said DePIN tokens serve as network incentives, not investment contracts. That decision reduced regulatory pressure on projects like Zebec, which works on blockchain-based payroll systems and real-world DePIN infrastructure.
Following the announcement, the overall DePIN sector rose by about 3% and ZBCN led those gains. The timing suggests the rally came mainly from regulatory optimism, not whale activity.
Exchange Transfers Show Internal Movements
The transactions shown in ZBCN-Man’s screenshots are real, but they don’t appear to be whale buys. Blockchain records show that most of the large transfers came from exchange wallets — including KuCoin, Gate.io, HTX (Huobi), and Crypto.com.
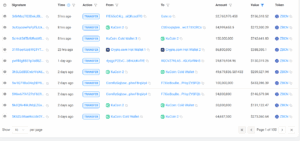
These are internal exchange movements, often done to manage liquidity between hot and cold wallets. When whales accumulate, tokens typically move off exchanges into new private wallets — not the other way around. That pattern is missing here, which points to routine exchange activity, not accumulation.
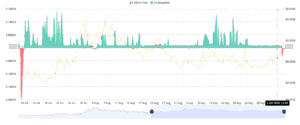
Trading data also supports this conclusion. Zebec Network’s daily trading volume nearly doubled to about $30.8 million, but that activity is spread across several exchanges rather than centered on one platform. Gate.io and HTX (Huobi) handled the largest share of trading, followed by OKX, KuCoin, and Bitget. Each exchange accounted for roughly 10% to 20% of total volume — showing no single venue with outsized inflows.
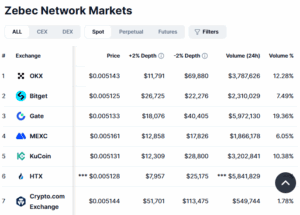
Such even distribution usually signals broad retail participation instead of large coordinated buying. If whales were truly accumulating, one or two exchanges would typically show sudden, heavy demand — and that isn’t visible here.
In derivatives trading, there’s little sign of large investors entering. Open Interest (OI) is steady near 13.7 million ZBCN, showing no wave of leveraged longs. Funding rates are neutral to slightly negative, and just $5,290 in positions were liquidated over the last 24 hours — mostly shorts worth about $5,040.
Such small figures indicate low leverage participation, meaning most of the current movement is coming from spot buyers, not institutional traders using futures.
Technical Indicators Shows a Short-Term Breakout
From a technical standpoint, ZBCN price has broken above a descending channel that started in mid-August. It now trades above its 20-, 50-, and 100-day EMAs, showing improving short-term momentum. However, the RSI sits near 69, suggesting the token is close to the overbought range and may cool off soon.
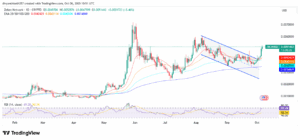
The pattern looks like a technical rebound supported by positive news, not long-term accumulation by whales.