
AIXBT has lost over 90% of its value since January 2025, falling from $0.90 to about $0.10. Despite this steep decline, analyst Osemka believes the token’s chart structure mirrors Bitcoin’s 2018 bottom — a pattern that preceded one of the strongest rallies in crypto history. But can history really repeat itself today? Find out in this analysis.
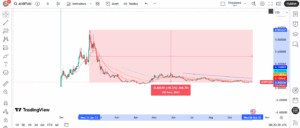
Chart Compression Points to Possible Mid-October Move
In a post on X, Osemka compared AIXBT’s current daily chart to Bitcoin’s 2018–2019 base formation. Both show a long descending pattern followed by tight price compression along a horizontal support zone.
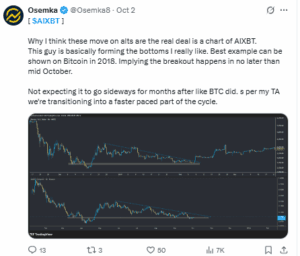
He argues this structure signals “a faster-paced part of the cycle,” projecting that AIXBT could break out by mid-October if it clears resistance near $0.13.
But while the charts may look alike, the factors that fueled Bitcoin’s 2018 recovery are largely absent from today’s market.
Why Bitcoin Rallied in 2018
Bitcoin’s recovery in late 2018 wasn’t simply a technical breakout — it was driven by deeper structural and economic shifts. After the 2017 bubble burst, Bitcoin’s price fell to a level close to its mining cost. As unprofitable miners shut down operations, selling pressure eased, creating a natural price floor around $3,000.
At the same time, the market underwent a significant cleanup. Hundreds of small or failed altcoins disappeared, concentrating liquidity back into Bitcoin and a few established assets. The remaining players were stronger, more patient investors rather than speculative traders.
The ecosystem itself matured. Better exchanges, custody solutions, and transparency standards emerged, laying the groundwork for institutional entry. Meanwhile, regulators in key markets like the U.S. and Japan began clarifying how digital assets would be treated under existing laws, which reduced uncertainty and encouraged cautious inflows.
Lastly, macroeconomic conditions played a role. Global monetary policy remained relatively loose, allowing capital to flow back into risk assets — a trend that supported Bitcoin’s rebound as broader markets stabilized in early 2019.
Together, these factors created a foundation for Bitcoin’s 300% rally once it broke above long-term resistance.
But… 2025 is Not 2018
However, none of those stabilizing factors exist for AIXBT today. The token lacks a mining-based cost structure that can define a clear price floor, and it doesn’t benefit from institutional support or regulatory recognition. Liquidity remains shallow, and its market behavior is driven largely by speculation.
Unlike 2018, the macro environment is restrictive. Global interest rates remain high, and investor focus is centered on Bitcoin ETFs and established large-cap assets, not experimental altcoins. This makes AIXBT’s technical setup less likely to produce the same sustained effect as Bitcoin’s 2018 breakout.
AIXBT’s On-Chain Data Shows Little Real Activity
On-chain data from Solscan shows that most AIXBT holdings remain concentrated among a small group of wallets. The ten largest addresses collectively control about 45% of the circulating supply, including nearly 19% stored in the Raydium liquidity pool. That concentration gives the market trading depth but also keeps most of the token’s supply in a few hands.
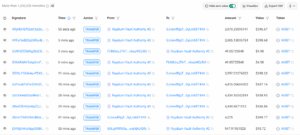
Solscan’s latest transfer records reveal consistent movement between Raydium Vault Authority and one wallet, GJvewfRjqT…65T4YA, with transactions taking place every few minutes. Each transfer ranges between $390 and $440 worth of AIXBT. The frequency and pattern of these transfers indicate automated liquidity operations rather than new buying from external investors.
In derivatives markets, CoinGlass data shows open interest has fallen from roughly $90 million in July to $34.6 million this week, while funding rates hover near +0.0069%. The flat funding rate points to balanced positioning, with neither long nor short traders taking aggressive bets.
AIXBT’s Technicle Structure Shows Market Exhaustion
AIXBT price continues to trade in a narrow range between $0.09 and $0.13. The chart shows a descending wedge pattern — a structure that often forms during the final stages of a downtrend when volatility compresses and trading volume declines.
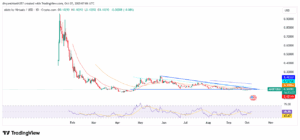
The 50-day exponential moving average (EMA) has flattened just below $0.11, while the 200-day EMA sits near $0.13. The two averages are now converging, creating a short-term decision zone. A daily close above the 200-day EMA would mark the first bullish crossover in months.
The Relative Strength Index (RSI) on the daily chart hovers near 49, showing neutral momentum — neither overbought nor oversold. Volume on recent candles has been light, confirming reduced participation as traders wait for direction.
If AIXBT price breaks above $0.13 with rising volume, the pattern’s measured move suggests a possible short-term advance toward $0.22–$0.30, matching the depth of the wedge. But if the token fails to clear resistance and slips below $0.09, it would extend its consolidation phase, likely revisiting $0.07–$0.08 support levels.
Return for in-depth analysis as institutional sentiment, macro headwinds, and technical positioning shape AIXBT’s next phase.