
Lingrid, a well-known analyst, has suggested that XRP is on track to hit a new yearly low, but shared what could invalidate the bearish trend.
Notably, Lingrid’s analysis takes inspiration from XRP’s current struggles amid the ongoing broader market uncertainties. For context, after recovering from the Oct. 10 crash, XRP has remained in a bearish position, down 14.22% this month, as it changes hands at $2.44 at press time.
Lingrid first presented her XRP commentary on Oct. 18, when the price showed short-term weakness. At the time, XRP traded for $2.33, recovering from a mild pullback earlier that day. Despite the immediate rebound, Lingrid confirmed that XRP still traded within a downward channel on the 4-hour chart.
XRP Could Target $2.1
Specifically, data from her chart shows that this channel started forming in late August, and XRP has continued to trade within it since then. Interestingly, the chart also features a blue descending trendline that has divided the channel into two parts, acting as resistance and hindering a possible price push to the upper section of the channel.
After three failed attempts, XRP broke above this blue resistance trendline on Oct. 1 and soared to retest the upper end of the channel a day later, as prices rose to $3.1. However, the tougher resistance at the upper end of the channel led to a pullback.

Despite the pullback, XRP held above the blue resistance trendline until the Oct. 10 crash that pushed prices below $2.7. Since then, XRP has struggled below the blue resistance trendline. It retested the trendline during the rally to $2.63 on Oct. 13 but couldn’t break through.

Another correction followed, leading to Lingrid’s bearish bias on Oct. 18. According to the analyst, XRP remains trapped within the descending channel, forming lower highs and lower lows. She noted that if this momentum continues, XRP could collapse to retest the lower end of the channel at $2.10.
A Possible Lifeline for XRP
However, the analyst provided a possible lifeline. She emphasized that if XRP could break above the $2.5 price level, this would invalidate the downtrend. More specifically, Lingrid revealed that a breakout above $2.45 could set the stage for a possible trend reversal, pushing XRP to a $2.83 price.
To Lingrid, this change could come from a shift in Bitcoin sentiment from bearish to bullish. In addition, another factor that could trigger this bullish turn of events is an unexpected regulatory or liquidity development. For instance, JPMorgan confirmed yesterday that it expects the Federal Reserve to end quantitative tightening next week. This could boost liquidity for the crypto market.
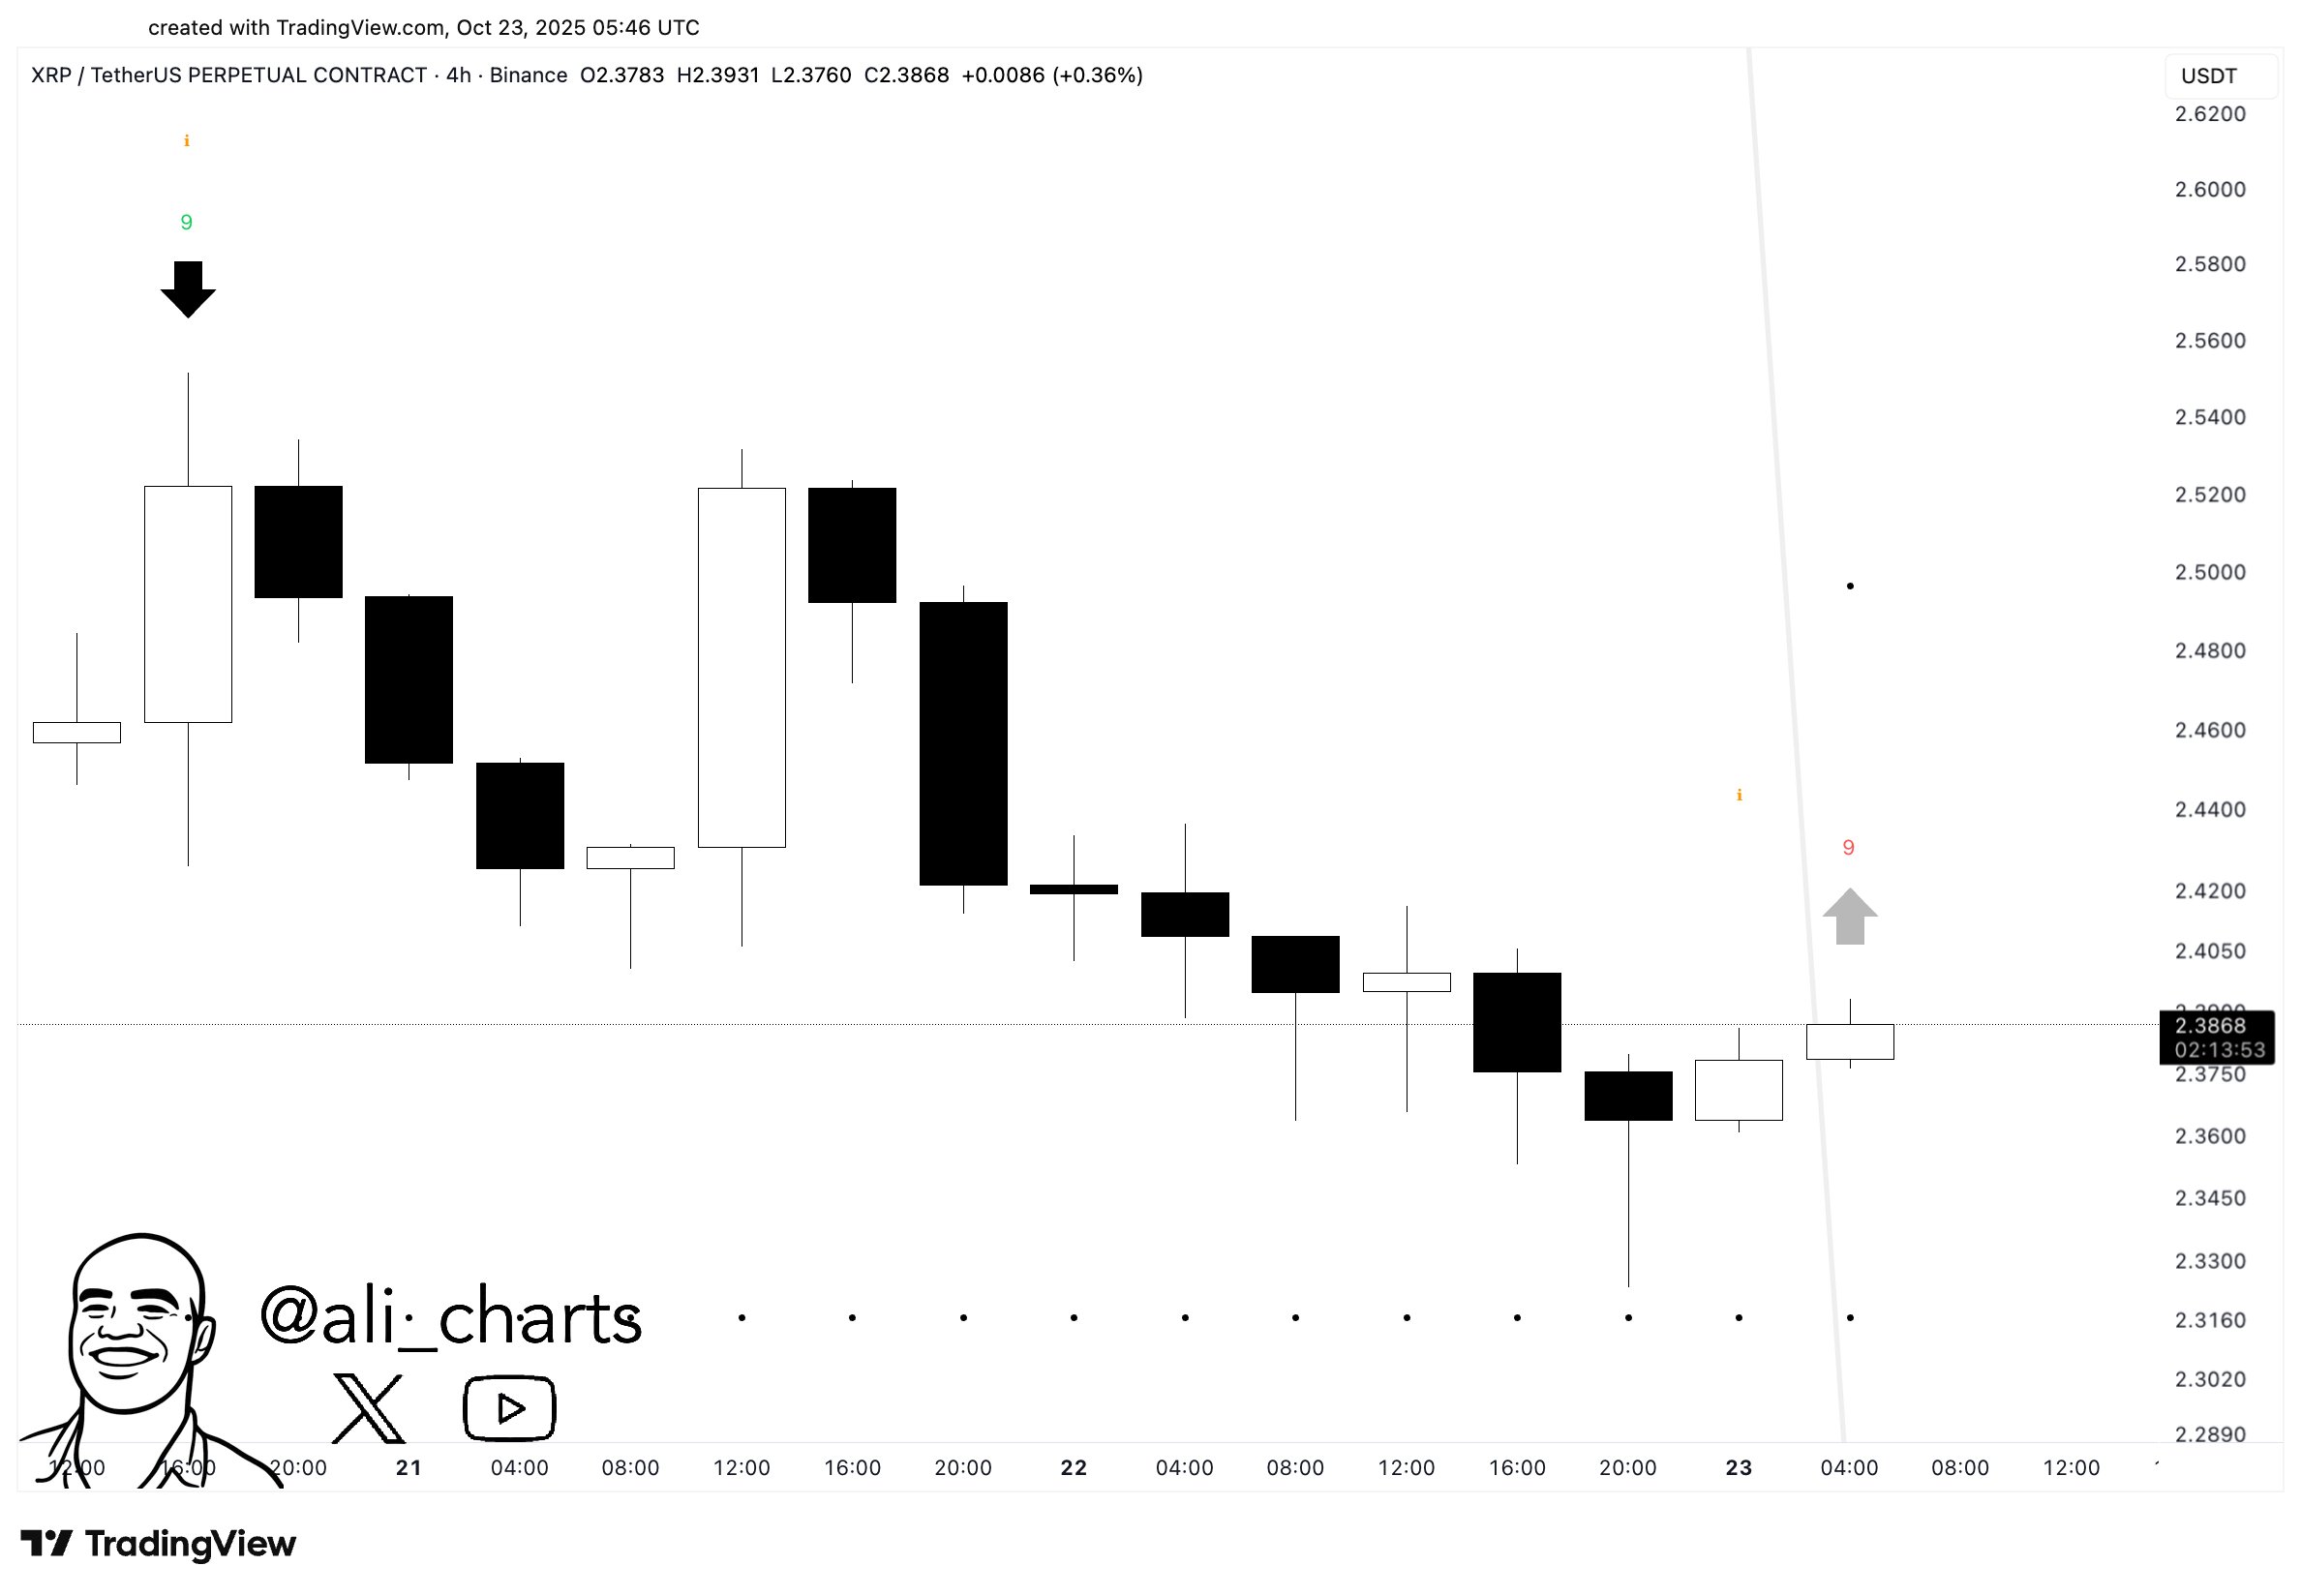
While Lingrid leans bearish, most other analysts believe XRP has maintained resilience. Specifically, market watcher EGRAG Crypto argued that XRP has not witnessed any bearish breakdown on the monthly chart, insisting that the chart shows strength. Moreover, analyst Ali Martinez recently pointed out that the TD Sequential has flashed a buy signal on the 4-hour chart.
DisClamier: This content is informational and should not be considered financial advice. The views expressed in this article may include the author’s personal opinions and do not reflect The Crypto Basic opinion. Readers are encouraged to do thorough research before making any investment decisions. The Crypto Basic is not responsible for any financial losses.