
Walmart-backed OnePay plans to add Bitcoin and Ether trading and custody through Zero Hash this year, according to multiple reports and corporate materials. Outlets summarizing CNBC’s scoop say OnePay will use Zero Hash’s crypto-as-a-service stack to enable buy, hold, and convert inside the app.

However, today there is no official announcement linking Zebec Network to this OnePay–Zero Hash integration. Zebec has appeared at a Zero Hash conference and in interviews, which shows ecosystem contact, but it is not a product partnership with OnePay. No new Zebec statement or Zero Hash release today changes that status.
ZBCN chart shows a long consolidation channel, not a clean bull flag
The ZBCN/USD chart compresses price between two downward-sloping trendlines since June, forming a broad descending channel. A classic bull flag needs a strong, near-vertical “pole” followed by a tight, parallel pullback. Here, the pullback spans months, swings are wide, and the channel angle is shallow. That structure looks more like accumulation inside a range than a textbook flag.
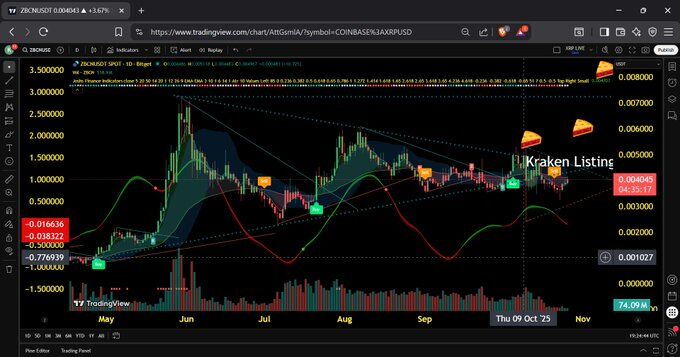
Price rides an EMA ribbon that flips between support and resistance. Each approach to the upper boundary fades without expanding volume, which signals weak follow-through. Breakouts from channels usually require a clear daily close above the upper trendline and a visible volume spike. The recent “Kraken listing” label marks a news catalyst, yet the candles near it remain small and volume stays muted, so momentum confirmation is missing.
The lower boundary has held multiple times, which shows buyers defend that zone. However, higher highs are not established; swing peaks align under the same diagonal cap. Until candles close above that cap and the ribbon turns up with volume, the structure reads as rangebound. In short, the chart argues for patience: identify a decisive break and expansion before calling it a flag breakout.
ZBCN RSI shows momentum cooling but still above neutrality
The 14-period RSI broke above 50 around Oct 24–25, then pushed into the low-to-mid 60s on Oct 26. That move signaled a momentum shift from neutral to positive. However, the latest print retreats to ~55 while the RSI moving average hovers near ~61, which indicates a short-term pullback against a still-rising medium-term trend.
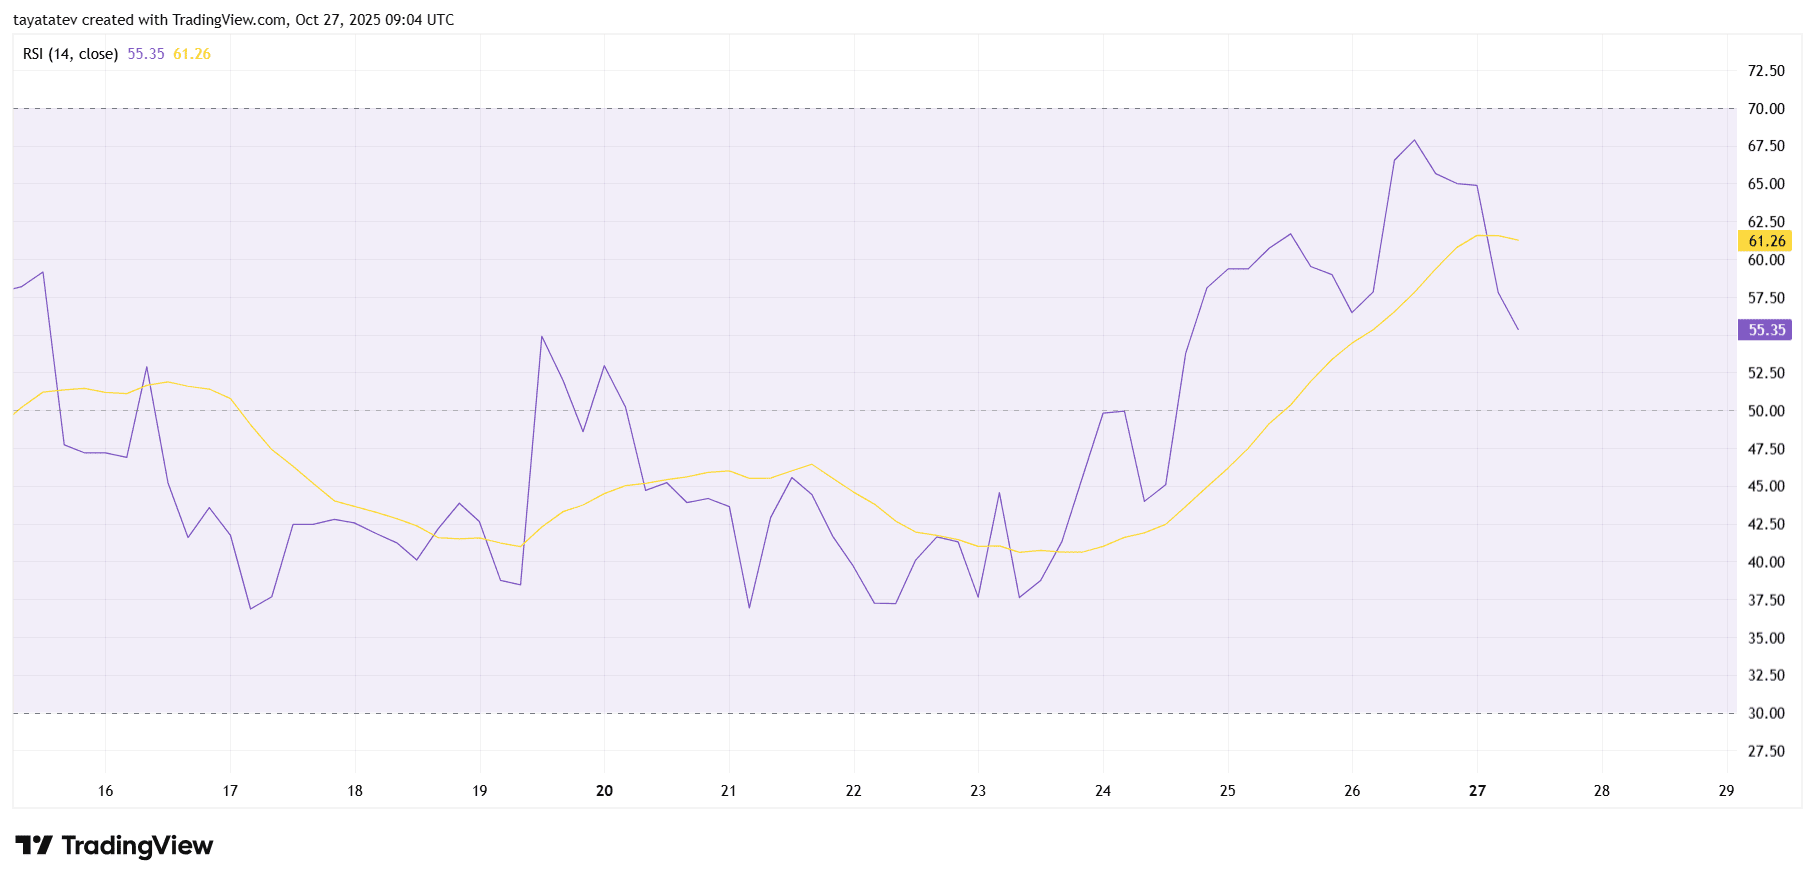
Importantly, RSI holding above 50 keeps the bias constructive. If buyers defend the 50 line and the RSI turns back through 60–65, momentum can re-accelerate. That sequence would confirm a higher-low in RSI and usually aligns with price expansion.
Conversely, a sustained slip below 50 would reset the signal to neutral and raise the risk of a deeper fade toward 45–40 on the oscillator. Therefore, watch for a rebound in RSI toward its rising average; a close back above it would restore upside momentum, while a breakdown through 50 would argue for caution.