
Ondo Finance used posts on X to highlight new usage data for Ondo Global Markets and to point readers to the Dune and RWA xyz RWA Report 2025. The firm said tokenized assets now exceed three hundred billion dollars in total value, and it shared slides on Ondo Global Markets activity since the September 3 launch. The updates focused on product mechanics, access rules, and early adoption rather than price.
Ondo said the Dune and RWA xyz report shows strong growth in tokenized assets across treasuries, credit, equities, and commodities. The firm framed its equities platform within that broader market. The posts directed users to the full report for sector level detail.

The company restated its aim to extend traditional exposures onto public chains. It presented the report as third party context for that strategy. The materials included charts that track market size and individual platforms.
Nathan Allman, Ondo’s founder and chief executive, said Ondo Global Markets expands financial access by taking U.S. securities onchain for global investors. He drew a parallel to how stablecoins moved the U.S. dollar onto blockchains. The quote appeared on an image in the thread.
Ondo reported that Ondo Global Markets has surpassed two hundred million dollars in total value locked. The platform launched on September 3 with more than one hundred tokenized U.S. stocks and ETFs. The firm said ETFs account for about fifty three percent of TVL, ahead of individual stocks.

Slides named several popular ETF tickers onchain. SPYon held about fifteen point nine million dollars, IVVon held about twelve point six million dollars, and TLTon held about eleven million dollars. The charts showed a steady rise in tokenized asset value through September 12.
The company also disclosed one hundred forty one million dollars in mint and redeem activity during the first week. It said instant mint and redeem at net asset value helps tokens track the underlying securities. The post described this activity as a sign of early engagement.
Ondo described each token as fully backed one for one by shares held with licensed U.S. broker dealers. It said the tokens mirror the total return of the underlying stock or ETF, including dividends that are reinvested. The firm presented this as economic exposure that matches the source asset.
Additionally, Ondo said trades route into Nasdaq and NYSE order books, not through automated market maker pools. The post argued this avoids slippage and fragmentation seen in AMM based models. The company paired that claim with a chart that grouped tokenized assets by value.
The platform supports transferability at all hours between peers. However, mint and redeem follows a market schedule and requires know your customer checks. The firm said this setup aligns onchain tokens with traditional market plumbing.
Ondo repeated its access limits in a separate compliance image. The company said tokens are not registered under the 1933 Securities Act in the United States. It added that offers are restricted to qualified investors in the European Economic Area and the United Kingdom, and to professional clients in Switzerland.
The disclosure said the tokens provide economic exposure to publicly traded assets but are not themselves stocks or ETFs. Holders do not receive or hold the underlying shares. The document also noted that investing involves risk, including the potential loss of principal.
Finally, Ondo pointed readers to its legal pages for full terms. The company emphasized jurisdiction specific restrictions. It also reminded users that past performance does not predict future results.
ONDO forms bullish pennant; 50% target sits near 1.54
September 17, 2025 — ONDO versus the United States dollar ONDO/USD on the daily chart shows a clean continuation setup. The price carved a bullish pennant in August after a sharp advance, then pushed higher out of it last week. A bullish pennant is a pattern where a strong rally (the “flagpole”) pauses inside two converging trendlines; when price breaks out in the direction of the prior move, technicians treat it as a continuation signal.
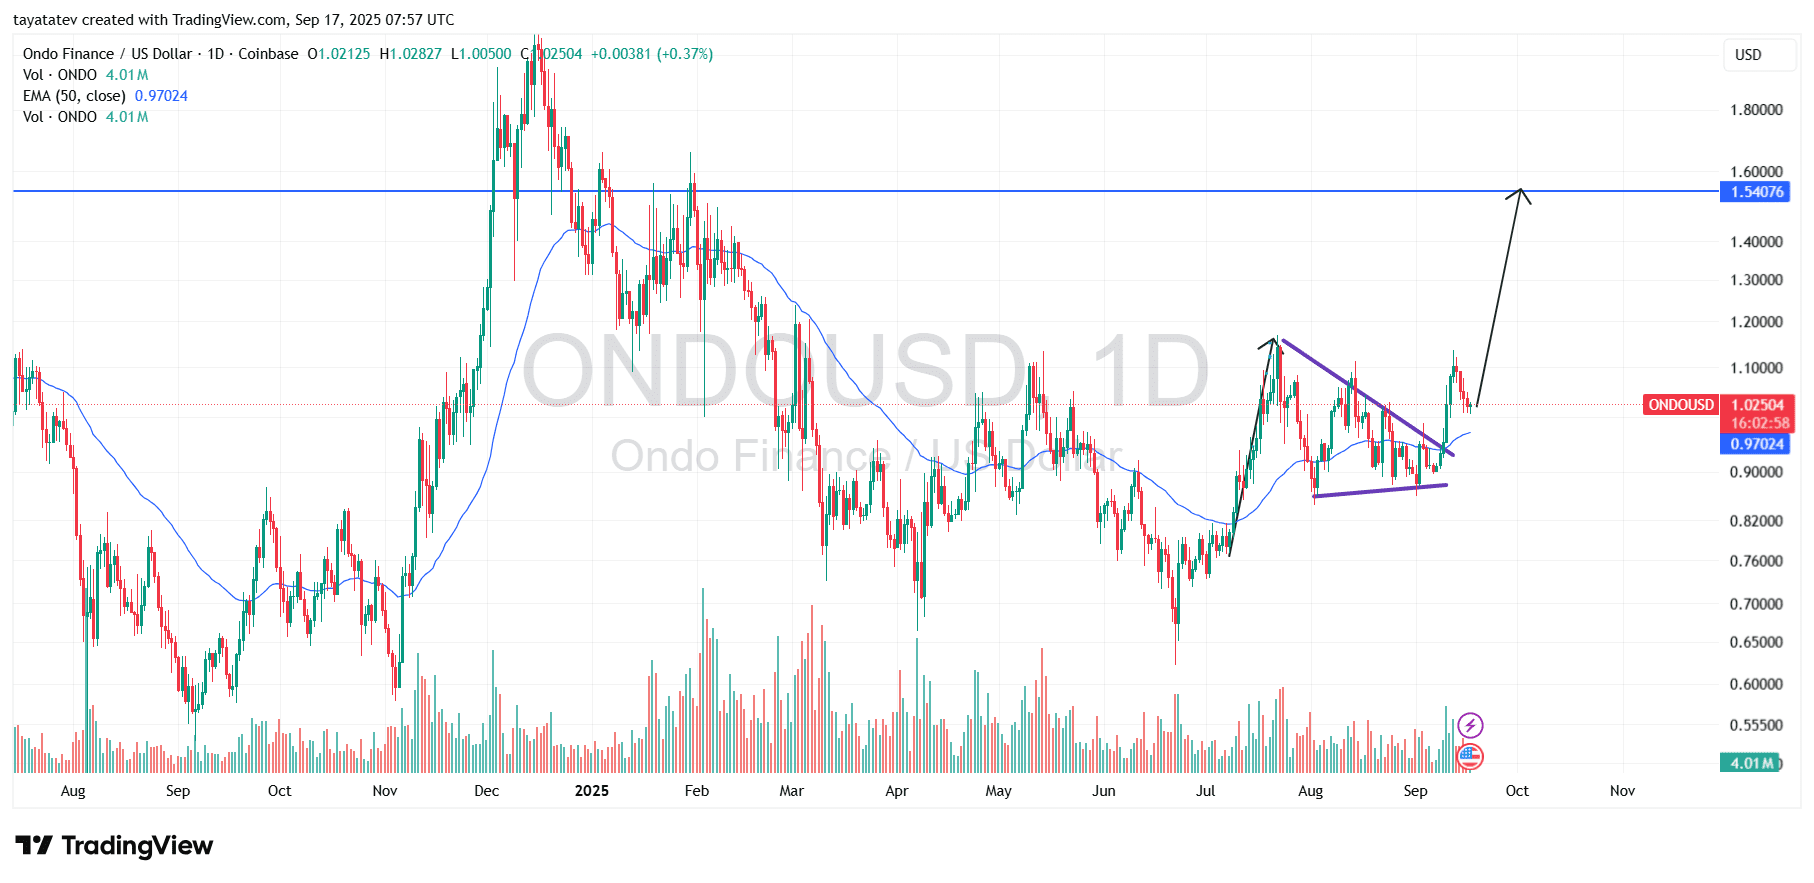
Price is now holding the breakout area and consolidating above the fifty-day Exponential Moving Average (EMA) near 0.97 United States dollars. Volume on the chart remains healthy for a consolidation phase, while the pullbacks have been shallow and contained inside a rising mini-channel. This behavior is consistent with absorbed selling after a successful breakout.
The next clear level is the horizontal supply zone around 1.54 United States dollars, which also matches the blue resistance line drawn on the chart. From today’s spot near 1.03 United States dollars, a measured continuation toward that band implies roughly a fifty percent advance, placing a practical objective at about 1.54 United States dollars. That target aligns with the prior congestion highs and the pennant’s flagpole projection, giving a reasonable confluence.
In the near term, the market is “up from the pattern” yet moving sideways as it digests gains. As long as daily closes stay above the breakout trendline and the fifty-day Exponential Moving Average, the structure favors continuation toward 1.54 United States dollars. A loss of those supports would indicate a deeper pause, but for now the consolidation looks constructive inside the broader uptrend.
ONDO versus the United States dollar shows a daily Relative Strength Index near 55, holding above the 50 midpoint while price consolidates after the breakout. The Relative Strength Index measures the speed of recent gains and losses on a zero to one hundred scale, with readings near seventy considered overbought and near thirty oversold.
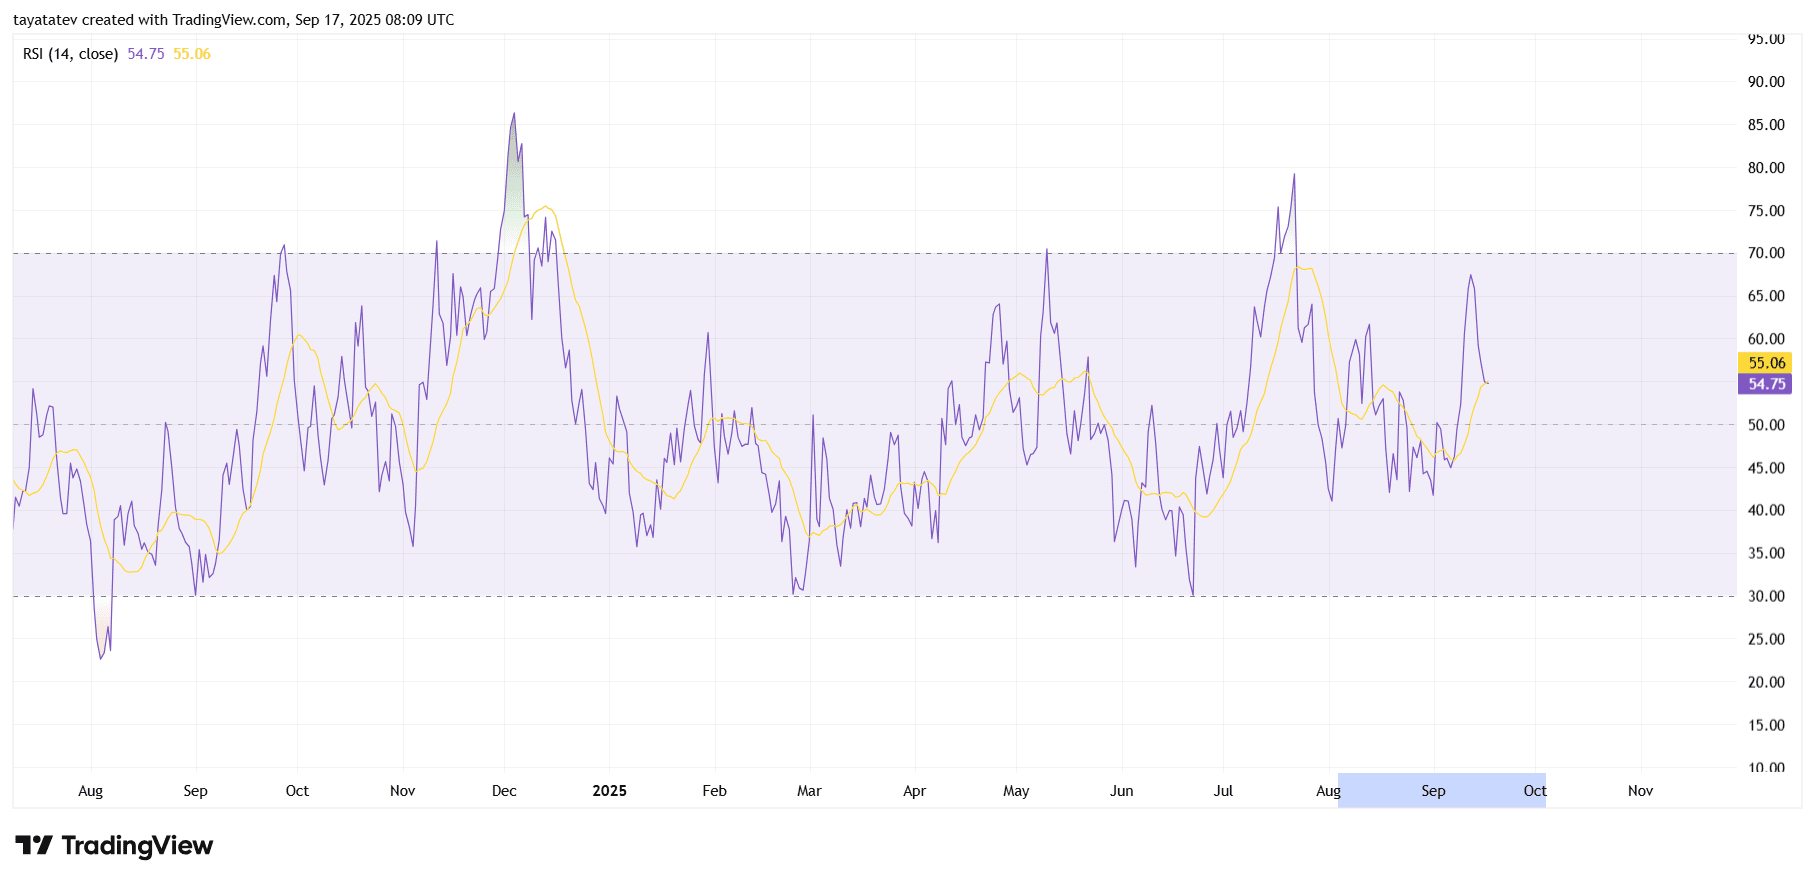
The oscillator turned higher from the mid-40s this month and crossed its signal average, showing improving short-term momentum. Because RSI sits in the mid-50s, the setup leaves room before typical overbought territory. That space allows price to digest gains without immediate pressure from stretched conditions.
Structure also improved. RSI has been making higher lows since early September while price moved sideways. This alignment shows strengthening momentum during consolidation rather than fatigue. If RSI can push toward the 60–65 zone and hold, trend confirmation strengthens. A daily close back below 50 would weaken the signal and argue for a longer pause.