

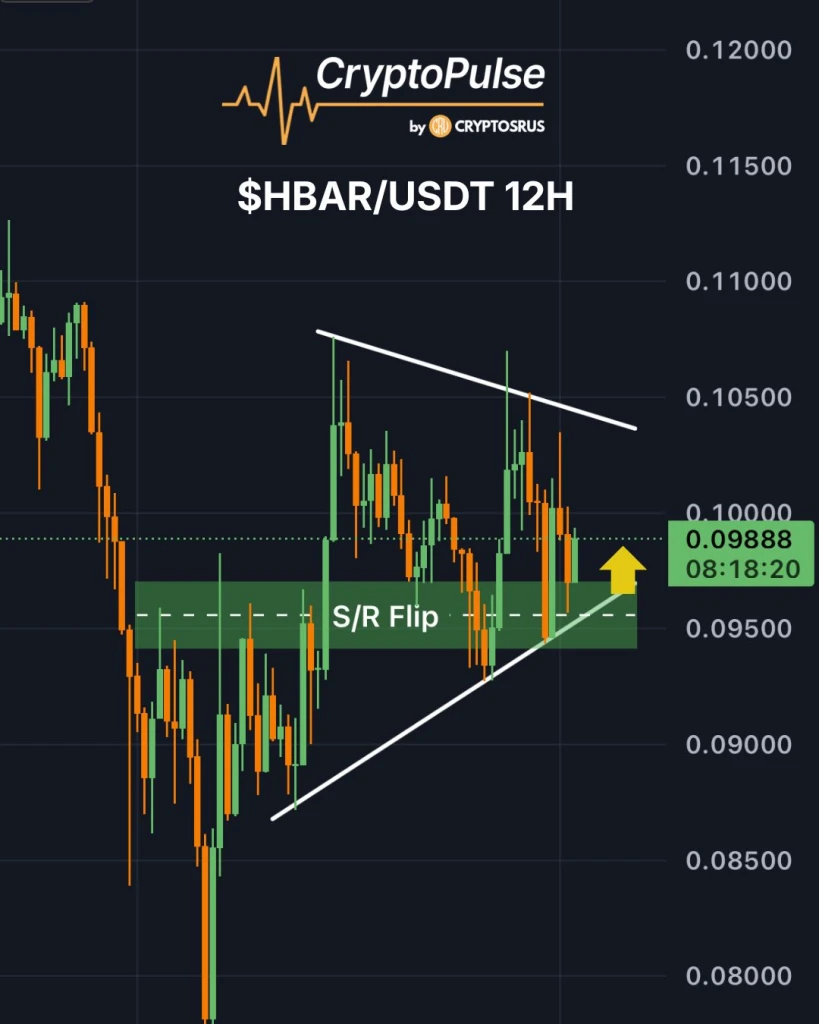
HBAR, the native token of Hedera Hashgraph, continues to defend the crucial $0.094–$0.096 support/resistance flip zone on the 12-hour chart.
According to the crypto analyst Crypto Pulse, this level, once resistance, now provides strong support, suggesting buyers are active. Maintaining this area keeps the market structure constructive, hinting at a potential continuation of upward momentum in the near term.
Source: Crypto Pulse X Post
The next significant barrier lies at the descending resistance near $0.104–$0.106. A decisive move above this zone could confirm short-term bullish strength and open the door for further gains.
Traders will monitor HBAR closely, as holding above the S/R flip reinforces optimism, while failure may trigger a retest of lower support levels, determining the token’s immediate trajectory.
Also Read: Hedera (HBAR) is Testing the $0.096 Support: Can a Flip Lead to $0.105?
HBAR Technical Outlook Points to Consolidation Phase
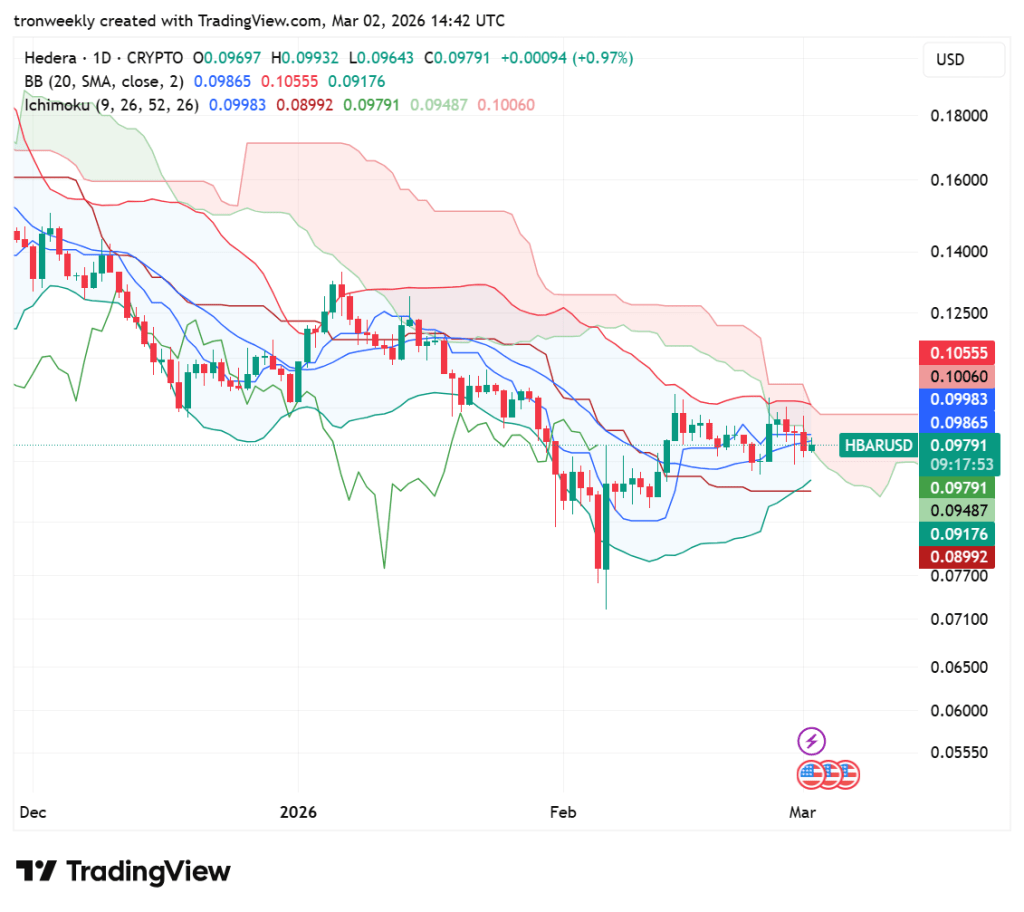
According to TradingView, since late 2025, the price has been trapped beneath the oppressive Ichimoku cloud, marking a persistent downtrend where every recovery attempt has been cut short.
Sellers have remained in firm control, pushing Hedera into a narrow, low-volatility corridor as the market catches its breath.
Source: TradingView
Currently, the token faces a critical crossroads at $0.09791. Price action is hugging the Bollinger Band middle line, which suggests that the asset is making a last gasp for direction.
While the formation of a green cloud suggests that better days are ahead, the $0.10 round number remains the last hurdle for the asset.
Momentum Indicators Point to Early Stabilization
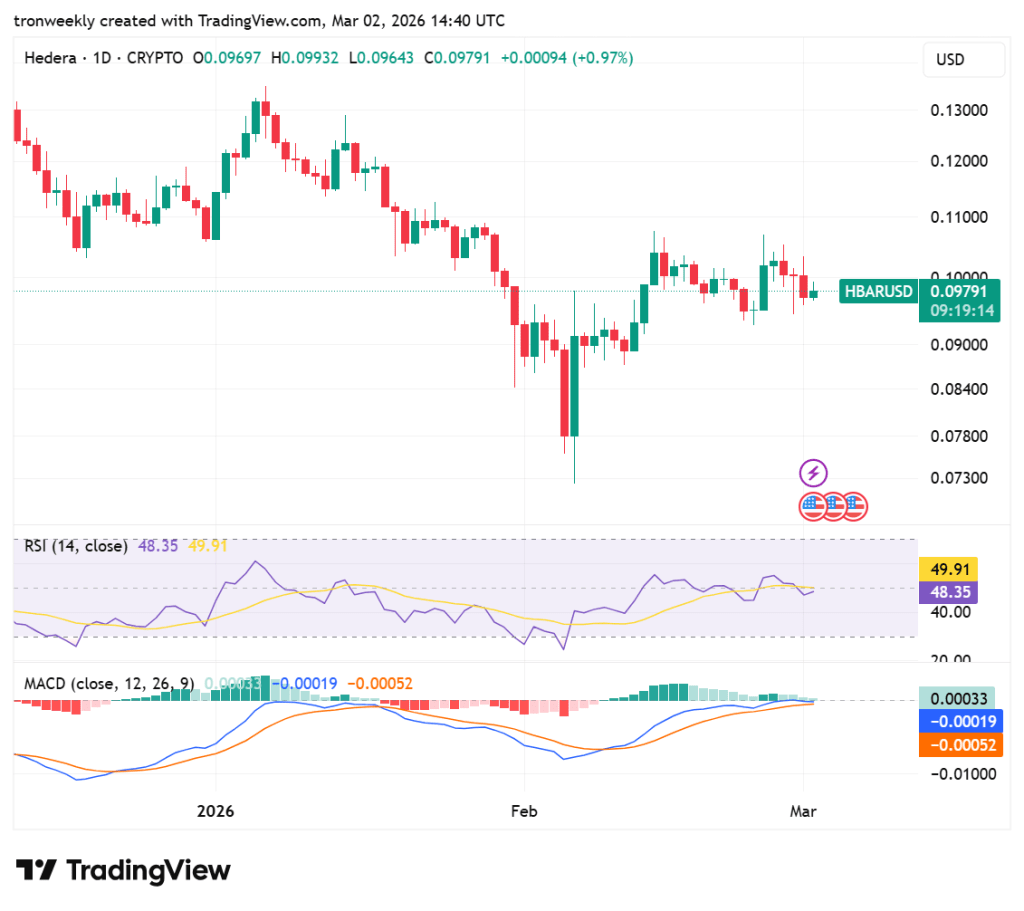
The RSI is positioned near the middle of the chart at 48.35, while the moving average is at 49.91. This is an indication of a neutral market, neither overbought nor oversold.
The price has oscillated around the 50 mark over the past few sessions. The momentum is neutral, neither buying nor selling. A wait-and-see approach can be adopted before the RSI goes into the oversold zone below 30 or the overbought zone above 70.
Source: TradingView
The MACD reveals strong convergence between the MACD line and the signal line, with all values around zero: histogram -0.00033, MACD -0.00019, and signal line -0.00052.
The small and moving histogram bars reveal low momentum. Both indicators reveal consolidation, which means that the market is expected to move sideways before a new trend emerges, with neither bulls nor bears dominating the market.
Also Read: Hedera (HBAR) Key Demand Zone Signals Potential Breakout Toward $0.57