

NEAR Protocol (NEAR) continues to attract stronger attention in the market with rising trading activities in recent days. Buyers have been reacting to technical signals indicating a change in trend.
As of writing, on Tuesday, NEAR Protocol (NEAR) is currently trading at $1.35, marking a 12.55% rise in a day. The trading volume is showing a strong bullish surge, up 159.45%, and is currently standing at $723.12 million. Over the last week, the coin price has gone up by 39.52%, according to CoinMarketCap data.

Source: CoinMarketCap
NEAR Shifts From Accumulation to Expansion
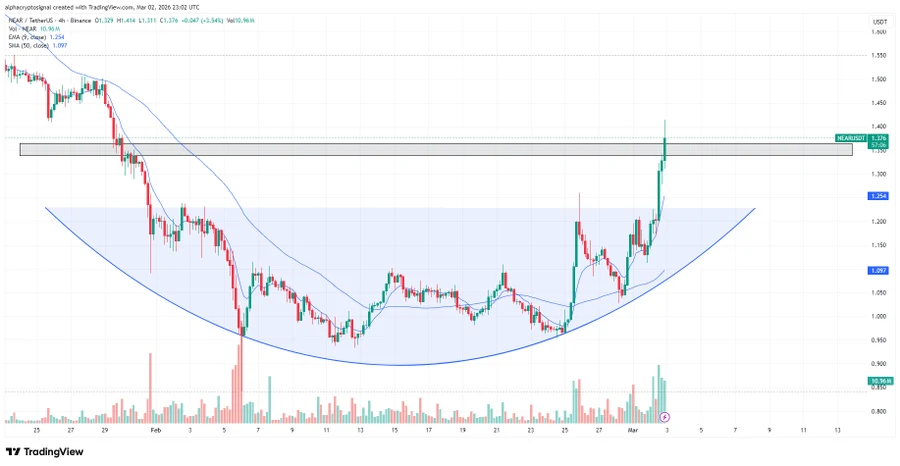
Analyst Alpha Crypto Signal highlighted that a clear breakout on the rounding bottom formation on the 4-hour chart. This has changed from a gradual accumulation to a broader expansion. NEAR has also taken back the resistance zone of $1.37 to $1.39 with sustained buying strength.
According to analysts, NEAR maintains a bullish outlook as long as the price remains above the breakout zone on retracements. As long as the price remains above the resistance zone, there is room for upward movement.
However, if the price goes below the resistance zone, it would signal a false breakout. However, the present setup continues to lean upward.
Source: X
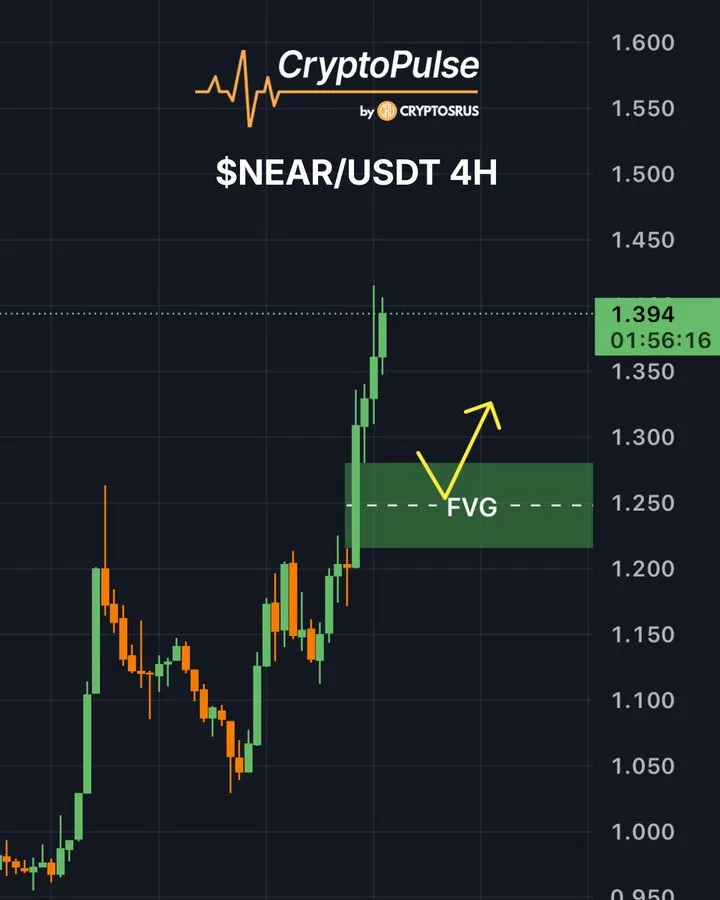
CryptoPulse, another analyst, mentioned that NEAR had a decisive impulsive breakout on the 4-hour chart. This caused a fair value gap to emerge between $1.23 and $1.27. This is a key area of interest for the token price action in the short term.
The analyst noted that if this fair value gap is a support level, then the token is likely to move to $1.45 and possibly higher. This is a key price level that will determine the extent of the current trend.
Source: X
Also Read: NEAR Cup and Handle Formation Suggests a Strong Rally Above $1.50
Volume and Open Interest Signal Increased Activity
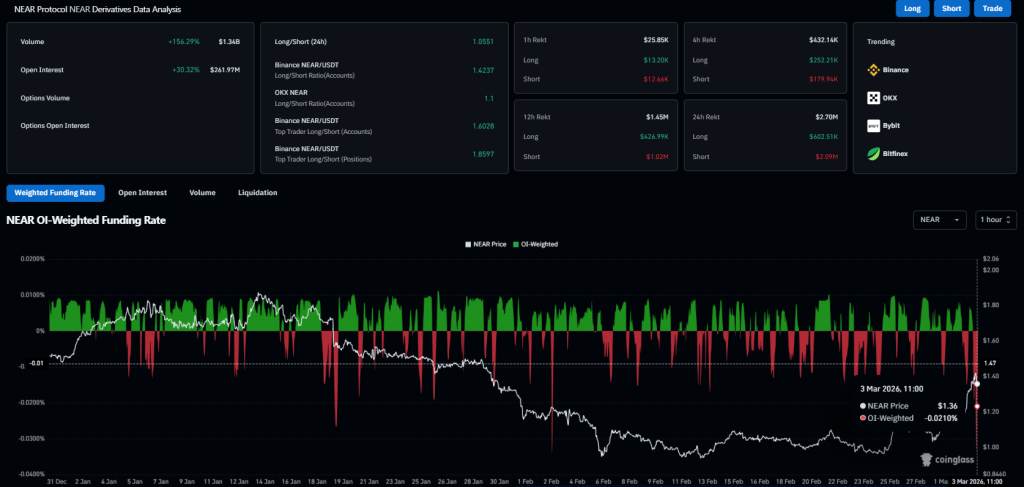
According to CoinGlass data, the trading volume increased by 156.29% to $1.34 billion. Open interest has also gone up by 30.32% to $261.97 million. The OI-weighted funding rate is -0.0210%, showing persistent pressure from short positions.
Source: CoinGlass
RSI and MACD Indicate Strengthening Market Trend
The Relative Strength Index (RSI) is showing improving momentum following the latest price move. The RSI reading is close to 64.40. This reflects improving buying activity without any extreme situations. The signal line is close to 45.76, reflecting a move from neutral to a stronger bullish trend.
Moving Average Convergence Divergence (MACD) also supported the positive outlook. The MACD line is at 0.051, while the signal line is at 0.014, forming a positive crossover. The histogram is printing at 0.037, indicating rising momentum and a stable trend.

Source: TradingView
The cryptocurrency has a strong bullish structure with support from rising volume and momentum. The key support levels will determine the continuation of the breakout. If sustained, the trend may continue higher.
Also Read: Pyth Network (PYTH) Nears Breakout With Targets Set At $0.07–$0.18