

TradingView data shows that Ethereum trades at approximately $1,990, about 2% lower in the last day, after being unable to break through the $2000 level again. The price weakness comes at a time when derivative positions are tightening, and network activity is very high.

Source: TradingView
ETH’s On-Chain Activity Reaches a 10-Year High
According to Santiment’s on-chain data, the underlying factors supporting the growth of the Ethereum network continue to be robust, despite the price volatility. Per Santiment, the daily active ETH address count is currently at approximately 837,200.
Compared to five years ago, ETH’s daily active addresses have grown by 82%, and relative to ten years ago, they are up more than 1,100%. As Santiment noted, the creation of new ETH wallets on a daily basis has grown by 64% over the past 5 years.
The number currently sits at approximately 284,800. Historically, large increases in both the number of active addresses and the number of new wallets created have corresponded to longer-term growth phases in ETH. This has occurred even during periods of short-term price volatility.
Also Read | Ethereum (ETH) Whale Activity Could Drive Short-Term Rally to $2,400
ETH Price Structure Contrasts On-Chain Metrics
Price structure remains under pressure, although on-chain data remains elevated. Glassnode data shows that ETH’s cost-basis distribution heatmap highlights substantial accumulation around $1,800.
This price zone represents the purchase for approximately 1.23 million ETH at an average purchase price of $1,890 during the last 30 days. $1,800 is also considered to be a key structural support level.
If ETH breaks below this level, it will likely drop to February’s lows. Additionally, CoinGlass’ ETH Exchange Liquidation Map shows that derivatives pressure is building near current prices.
There is considerable long liquidation risk concentrated around $1,900-$1,950, and cumulative short liquidation leverage is growing above $2,000. This creates a relatively tight volatility band around the psychologically important $2,000 level. A clear move out of this band can cause a chain reaction of liquidations on the other side.
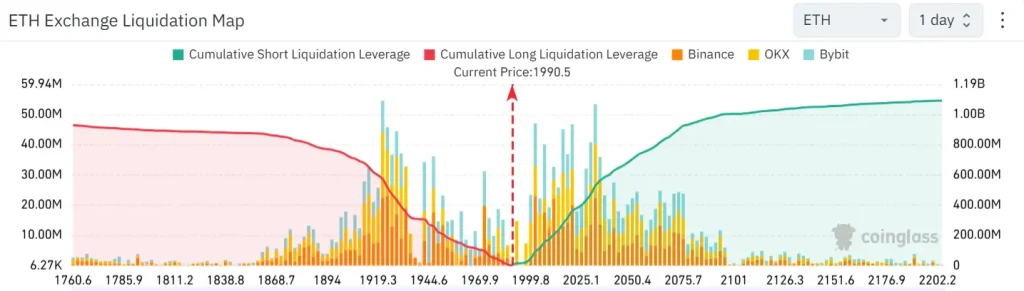
Source: CoinGlass
A Sign of a Broader Downtrend
Daily technical indicators show that Ethereum is in a larger downtrend. ETH is trading substantially below its 50-day exponential moving average (EMA) near $2,300, and well below the 200-day EMA near $2,945.
ETH remains below the 50-day EMA, and a sustained reclaim would be needed to shift short-term momentum. Until it does so, rallies will likely run into selling pressure. Momentum indicators are also showing cautious signals.

Source: TradingView
ETH’s current RSI is at 43, indicating that ETH has weak momentum, but not enough to consider it oversold. Additionally, volume relative to the previous selloffs is much lower, suggesting that the most recent rally had very little support from buyers.
Why This Matters
ETH is in between a position of increasing on-chain demand and decreasing derivative liquidity; therefore, the next breakout or breakdown will have significant market implications.
Also Read | Ethereum’s Next Major Upgrade Could Redefine Power in Block Production