

Shiba Inu (SHIB) is showing resilience as it holds above the lower boundary of a falling wedge pattern on the 3-day chart. According to the crypto analyst Jonathan Carter, this formation is often interpreted as a bullish reversal signal, suggesting that the current consolidation phase could be setting the stage for a potential upward price move in the coming sessions.
Buyers appear to be actively defending this key support zone, signaling confidence in SHIB’s potential to rebound. The consolidation phase, which has limited volatility, indicates that the market is stabilizing after recent fluctuations.
Jonathan Carter highlights that strong defense of this support often precedes upward breakouts, making this level a critical pivot point for traders and investors alike.
Also Read: Shiba Inu (SHIB) Shows Early Signs of Momentum With a $0.01 Target In Sight
Shiba Inu Falling Wedge Signals Explosive Rally
If a reversal is observed, technical projections indicate possible price targets at $0.0000068, $0.0000100, $0.0000130, $0.0000160, $0.0000220, and $0.0000330.
These prices can be viewed as a milestone where traders can make gains or take appropriate action. It is important to monitor the volume and overall market sentiment in order to determine if these price targets can be attained in the near and medium term.
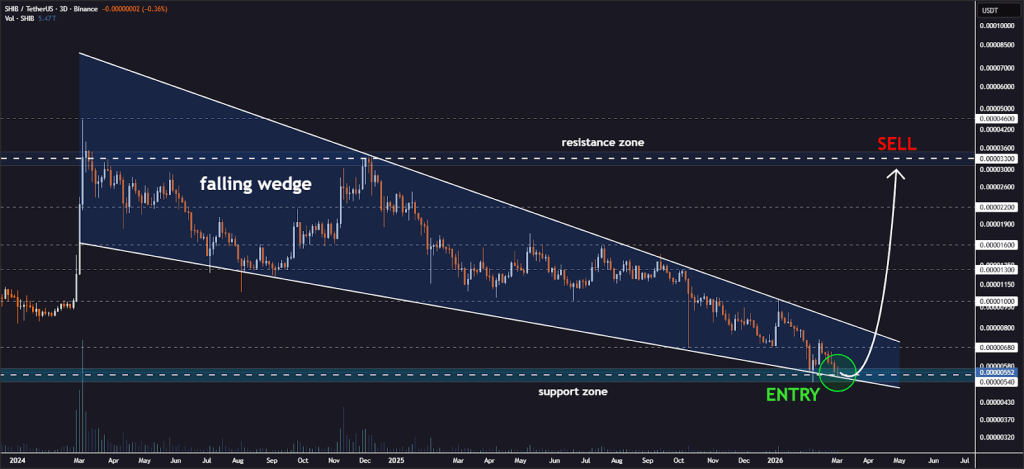
Source: Jonathan Carter’s X Post
Traditionally, falling wedge patterns that are supported have shown significant strength in terms of upward momentum. If this is the case for SHIB, then this could potentially mean more buying pressure, and the meme coin could reach even greater heights. The interest in this is high, especially since this could mean a major shift in terms of a bullish trend.
Momentum Indicators Point to a Potential Recovery
According to TradingView, the RSI is around 55.28, which puts it in a neutral to slightly bullish zone. The RSI has been rising from the mid-40s recently, and this shows increasing buying pressure.
The asset is under the control of the buyers, and it is not overbought. The yellow moving average is lagging the price action and supports the emerging bullish trend.
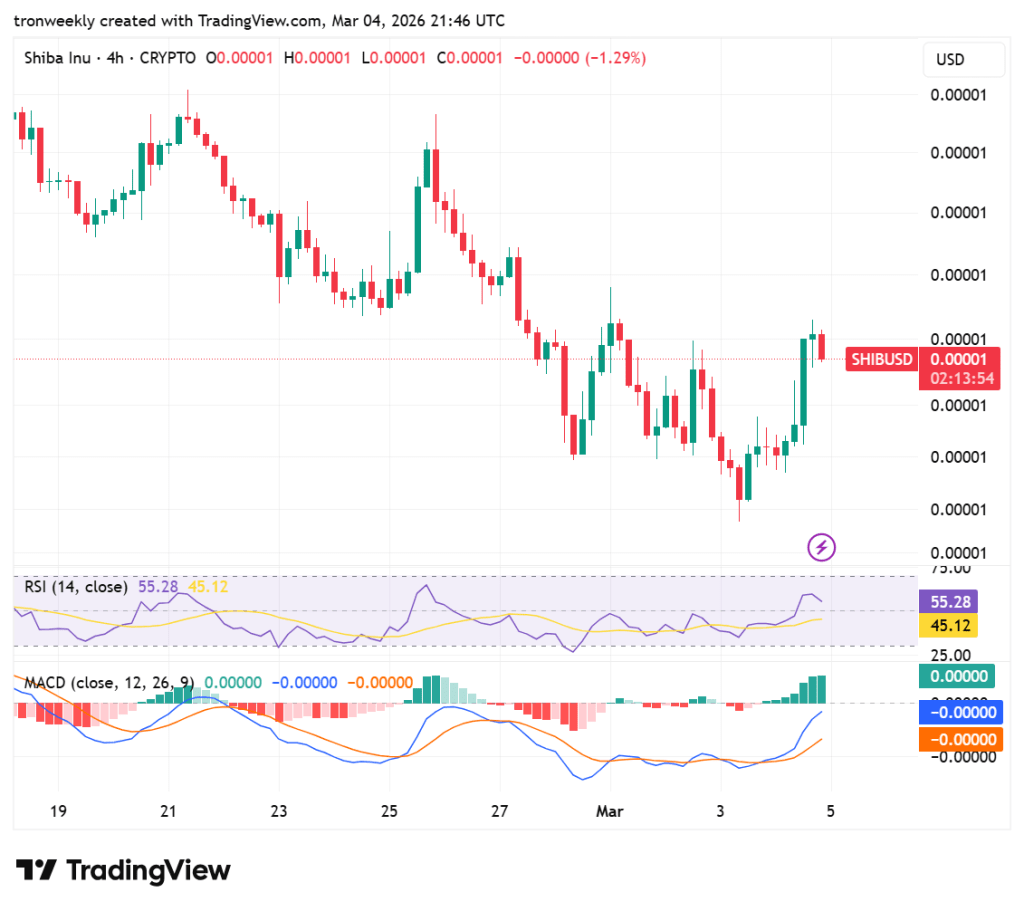
Source: TradingView
The MACD also shows a bullish crossover as the blue line is higher than the orange line. The histogram bars have also changed from negative to positive values, which is a sign of increased bullishness.
The absolute values are still zero, but it is clear that the MACD line and bars are rising, which is a sign of increased buying activity.
Also Read: Shiba Inu (SHIB) Derivatives Split Near 50-50, Target $0.000014733