
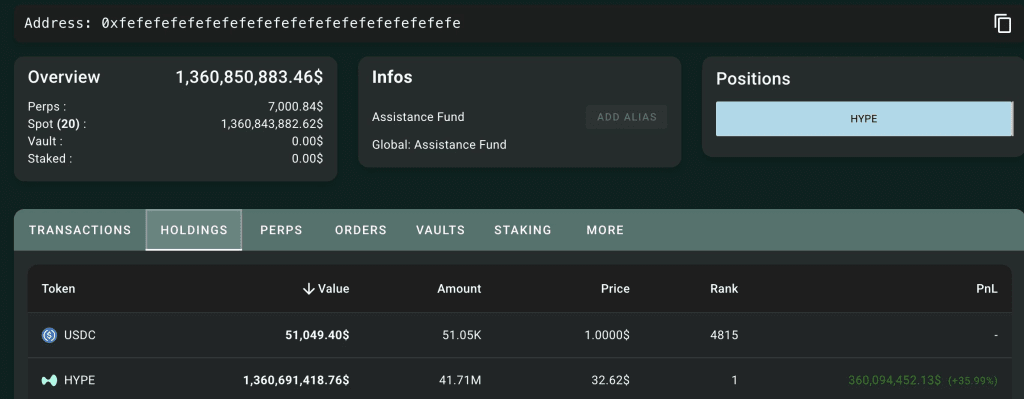
Hyperliquid has built an internal MicroStrategy-style vehicle known as the Assistance Fund to strengthen its token economy. As of March 5, 2026, the fund actively acquires and removes HYPE from circulation, reinforcing scarcity dynamics and signaling long-term confidence in the protocol’s growth and revenue-generation model.
The Assistance Fund has already deployed over $1 billion to burn HYPE tokens, bringing the total value to $1.36 billion, equivalent to 4.17% of the total supply. That 4.17% of HYPE will never reenter circulation, and the share is expected to keep increasing.
Also Read: Hyperliquid (HYPE) Nears $30 as Breakout Fuels Bullish Surge
Bullish Structure Targets $100 Range
According to a crypto analyst, HYPE continues to show a strong bullish structure following its falling wedge breakout on the 3-day chart.
The Price has reclaimed the $25–$30 zone and is advancing toward resistance at $35–$37, with momentum building toward $40–$42 and $48–$50 levels.
If buyers sustain strength above $50 and reclaim the macro supply near $55–$60, the broader structure shifts into full trend reversal territory.
A confirmed breakout above previous highs would open the path toward the psychological $80 region before extending toward the projected $100 target range.
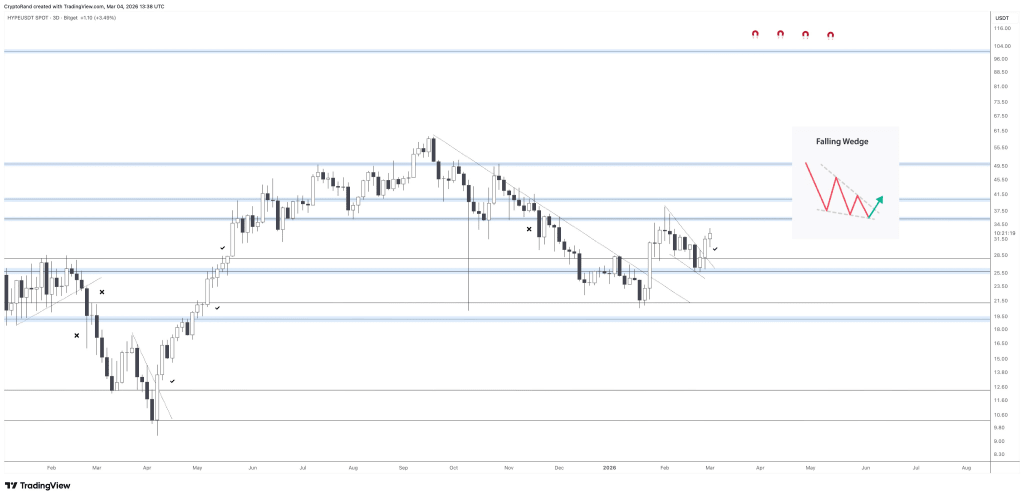
The bullish case still holds as long as the price stays above the support at $25-$26 and defends the deeper support at $21-$22 on a deeper correction.
Further higher highs and expanding volume can fuel the acceleration of the upside continuation, setting up the token for a potential macro rally to the projected price of $100.
Momentum Indicators Signal Strengthening Upside
From a technical point of view, on the 1D chart of Hyperliquid, the momentum indicator is showing signs of becoming constructive as RSI (14) is printing 56.38 and its signal line at 49.95. This is a sign of increasing buying pressure, as it is above the 50 midpoint and is yet to reach 70.

The MACD indicator (12,26,9), which is used to track the early signs of a recovery, is showing positive signals, and the MACD line is at 0.31934, the signal line is at 0.47168, and the histogram is reading at 0.15234, which is in the positive region and moving into green territory.
Why This Matters
With the constant 4.17% reduction in supply, liquidity becomes tighter, and the odds lean towards more pronounced price accelerations with the persisting buying pressure.
With the strengthening RSI and MACD indicators, the chart pattern leans towards a bullish continuation with the overcoming of resistance levels at increasing trading volume.
Also Read: Hyperliquid Surges 12% as Whale Buys $4 Million HYPE Tokens