

LayerZero (ZRO) is trading near $1.90, as experts flagged a potential breakout toward $2.58 following weeks of higher-low formations.
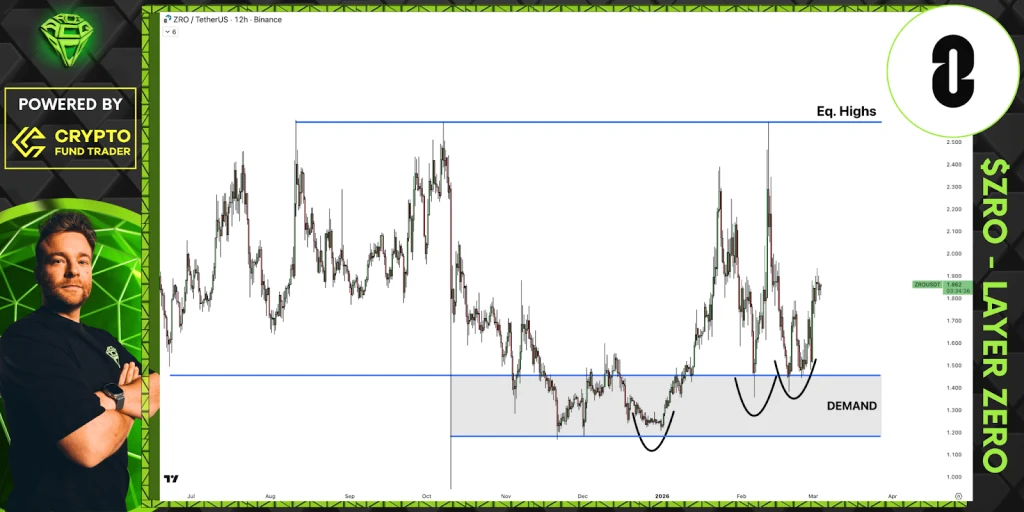
According to crypto analyst Sjuul, ZRO’s price action continues to carve a series of higher lows, a technical structure often associated with steady accumulation rather than weakness.
Buyers have stepped in at progressively higher levels, reinforcing short-term support and underlying strength. Data from CoinMarketCap and Binance confirm strong trading volumes supporting this consolidation phase.
Source: Sjuul’s X Post
As long as ZRO maintains support above $1.70–$1.78, attention shifts toward equal highs near $2.58. That zone represents a visible liquidity cluster, where clustered stop orders could accelerate volatility if breached.
A decisive push into this region may trigger momentum-driven upside, positioning the token for a potential breakout move.
Also Read: LayerZero’s (ZRO) Eyes $2.60 After Reclaiming Crucial Support Level
ZRO Technicals Point to Strong Recovery Phase Ahead
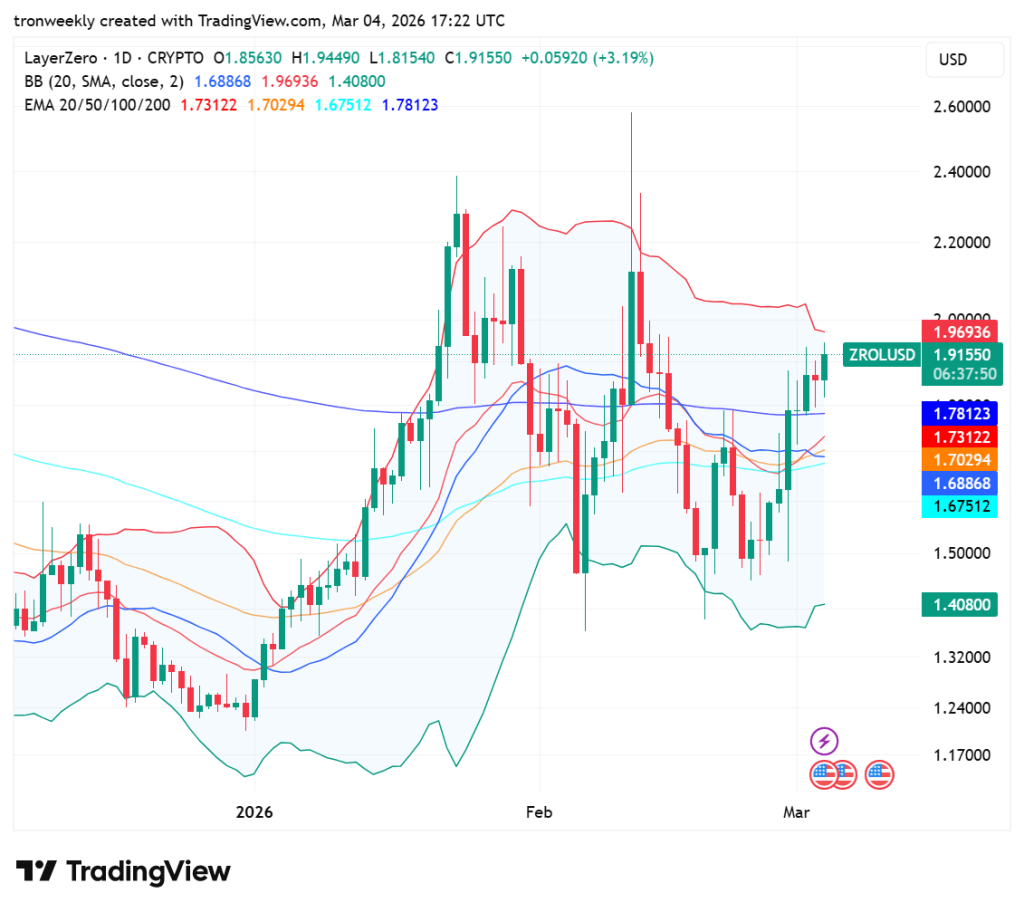
According to TradingView charts, ZRO shows a strong recovery after a late-2025 decline. The token was based near $1.20–$1.30 before rallying sharply into January, peaking above $2.40.
A volatile February pullback followed, with long wicks signaling heavy selling. Recently, buyers regained momentum, pushing the price toward $1.90 and forming higher lows in the short term.
Source: TradingView
From a technical perspective, ZRO has recovered the 20-day and 50-day exponential moving averages, which are rising, while the 100-day and 200-day exponential moving averages are at the bottom as support.
The Bollinger Bands have expanded during the rally and correction, but they are consolidating. The resistance is at $2.00, while the consolidation range is between $1.70 and $1.78.
Momentum Indicators Reinforce the Bullish Bias
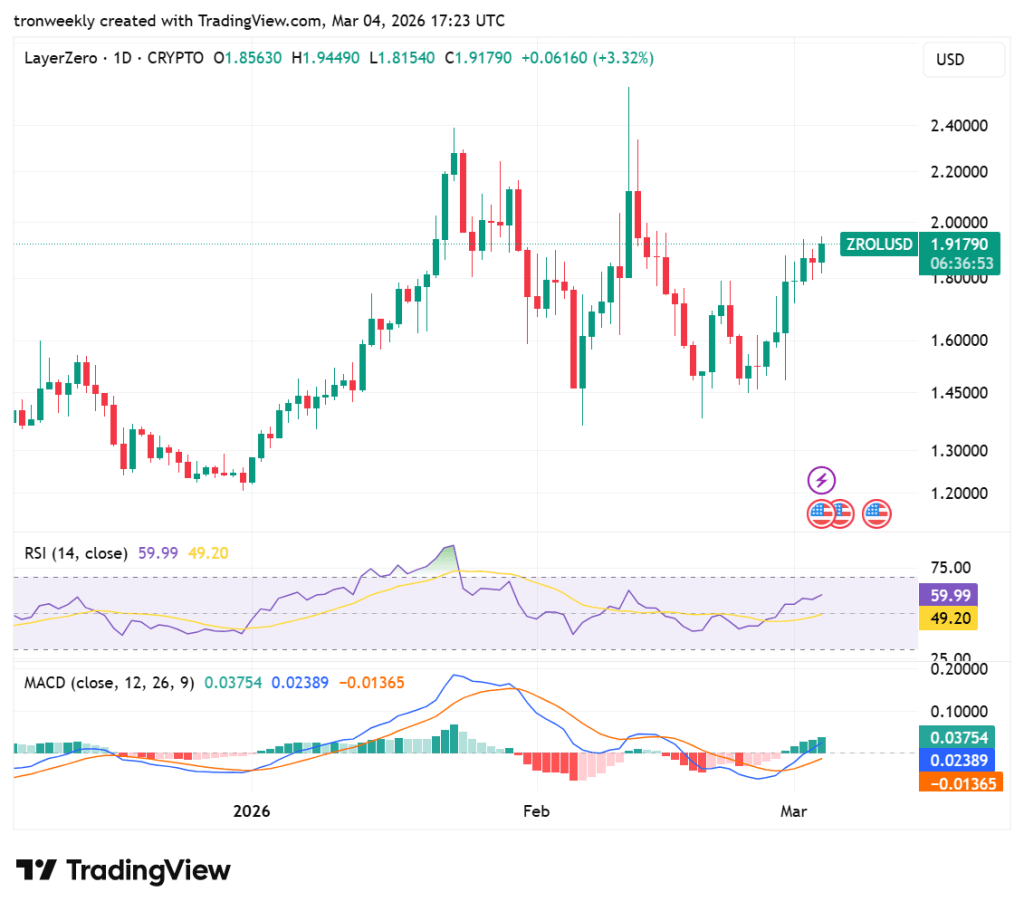
The RSI (14) indicator stands at approximately 60. This places the RSI in the bullish region. The RSI indicator remains below the overbought region at 70. The RSI indicator remains above its signal line at approximately 49.
This places the RSI in a position to show that there is relative strength. The recent slope in the RSI shows that there has been a change in momentum to the buying side.
Source: TradingView
The MACD (12, 26, 9) is showing the MACD line above the signal line, and this is a bullish crossover indicator, which usually signifies a continuation of the momentum.
The histogram bars are showing increasing bullish momentum strength as they are above the zero line and increasing. Although it is not very large, it is consistently increasing, showing that the momentum is increasing and not decreasing.
Also Read: LayerZero (ZRO) Price Rallies 21%, Eyes $4.27 Resistance Zone