

Bitcoin’s recent price movements have left investors divided on whether the cryptocurrency is ready to form a floor. After falling to a 60,000 USD low in the multi-year range, the 21% rebound of BTC has brought its price back to a major support level, where it is retesting.
Some technical indicators are signalling a reversal, thus from the point of view of investors, it is a crucial moment.
BTC Double, Bottom
Jelle, a crypto analyst, points out that the 12-hour chart of BTC is showing an “Adam and Eve bottom” pattern, which is a bullish reversal signal.
This implies that the sellers’ strength is diminishing and the change of the downtrend into an uptrend is likely to happen. The neckline of the pattern at 70,000 USD has been broken and it is important that the price stays higher than this level for the upside potential to be realised.
Also Read: AI Agents Choose Bitcoin Over Fiat in Recent 9,000+ Monetary Tests
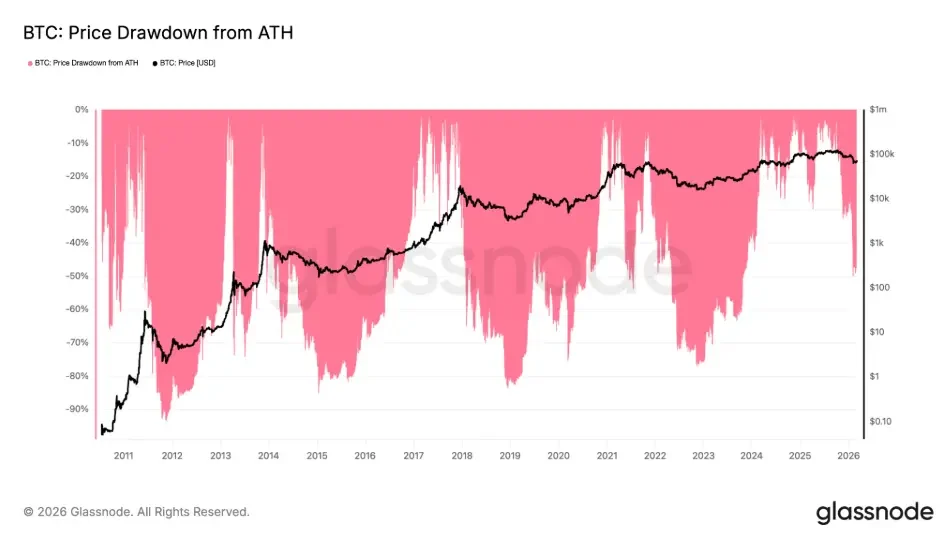
Bitcoin-Gold Ratio Chart Flashes
The BTC- gold ratio has been declining for nearly 13 months, reflecting the investors’ risk-off mode. Historically, the ratio tends to reach its lowest level around the same time as bitcoin’s price, which is then followed by a big bull run.
Coinbureau Nic Puckrin, the company’s CEO, pointed out that the present drawdown resembles those from previous cycles, thus the bottom is likely just around the corner.
Also Read: Bitwise Donates $233K to Bitcoin Open-Source Developers Through BITB
Ascending Channel Hints at Cycle Bottom
BTC’s monthly candlestick chart reveals the price testing again a multi-year support trend line, which was the turning point of previous bear markets.
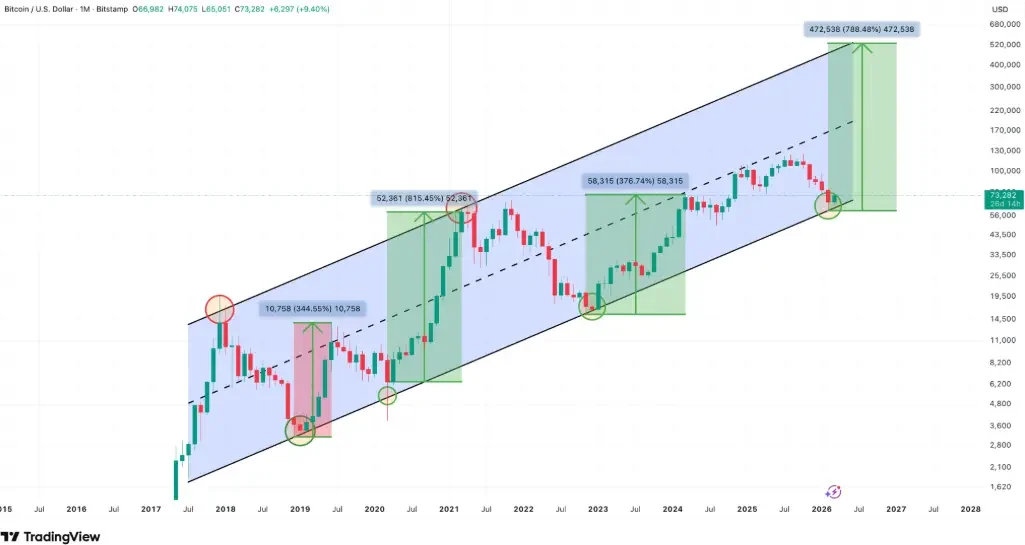
The trader and analyst at Coinvo Trading has a view that if history is repeated, BTC will touch this trend line once more and may even peak at roughly $500, 000.
Another analyst Rekt Fencer concurs, claiming that the BTC bottom is probably done.
Also Read: BTC Rises 7% Amid Geopolitical Tensions and Eyes $74,000 to $78,000 Resistance