

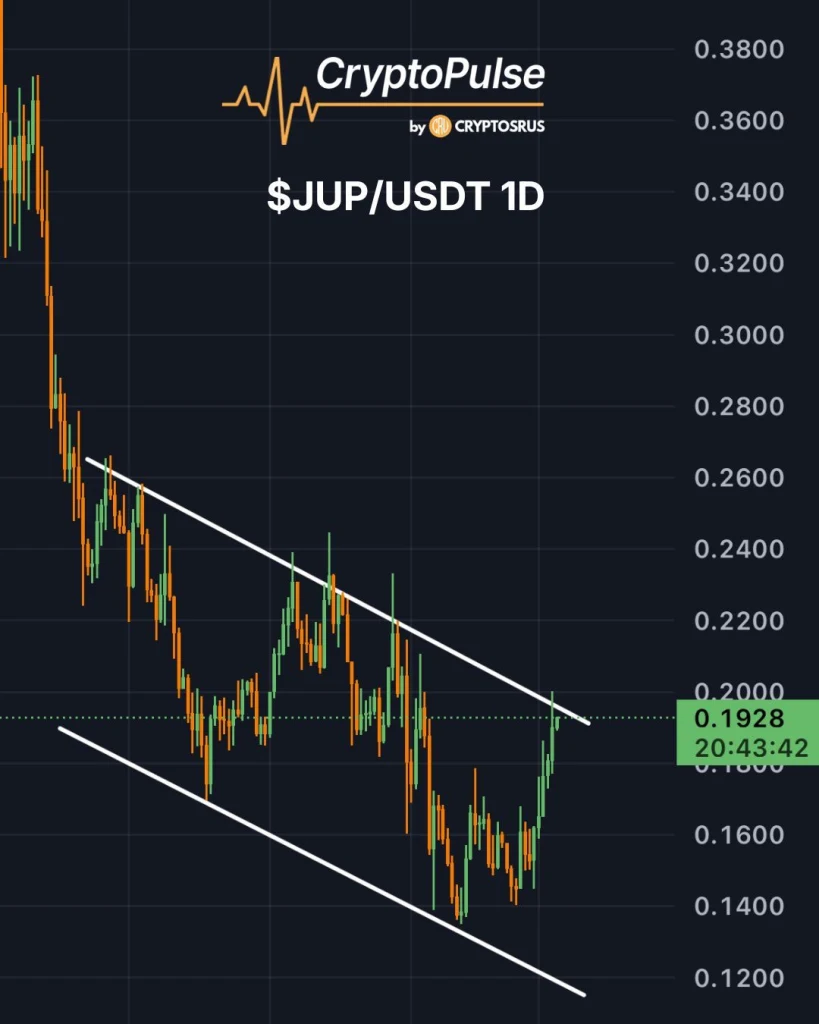
Jupiter (JUP) is testing a critical resistance near $0.20 on Thursday, March 5, drawing attention from traders and analysts alike.
According to the crypto analyst Crypto Pulse, a strong break and daily close above this level could ignite bullish momentum, potentially pushing the token toward $0.26.
Sustained buying pressure might even propel the token to challenge the $0.30+ zone, signaling renewed confidence among investors.
Source: Crypto Pulse’s X Post
However, risks remain for those betting on a rally. If JUP faces rejection at $0.20, it could retrace toward the $0.14 support level, reminding traders of ongoing market volatility.
The coming sessions will be decisive, as JUP’s performance at this threshold may determine whether it resumes an upward trend or encounters further downward pressure.
Also Read: Jupiter (JUP) Eyes $0.42 Breakout as Triangle Apex Approaches
JUP Price Could Pass $0.21 to Shift the Momentum
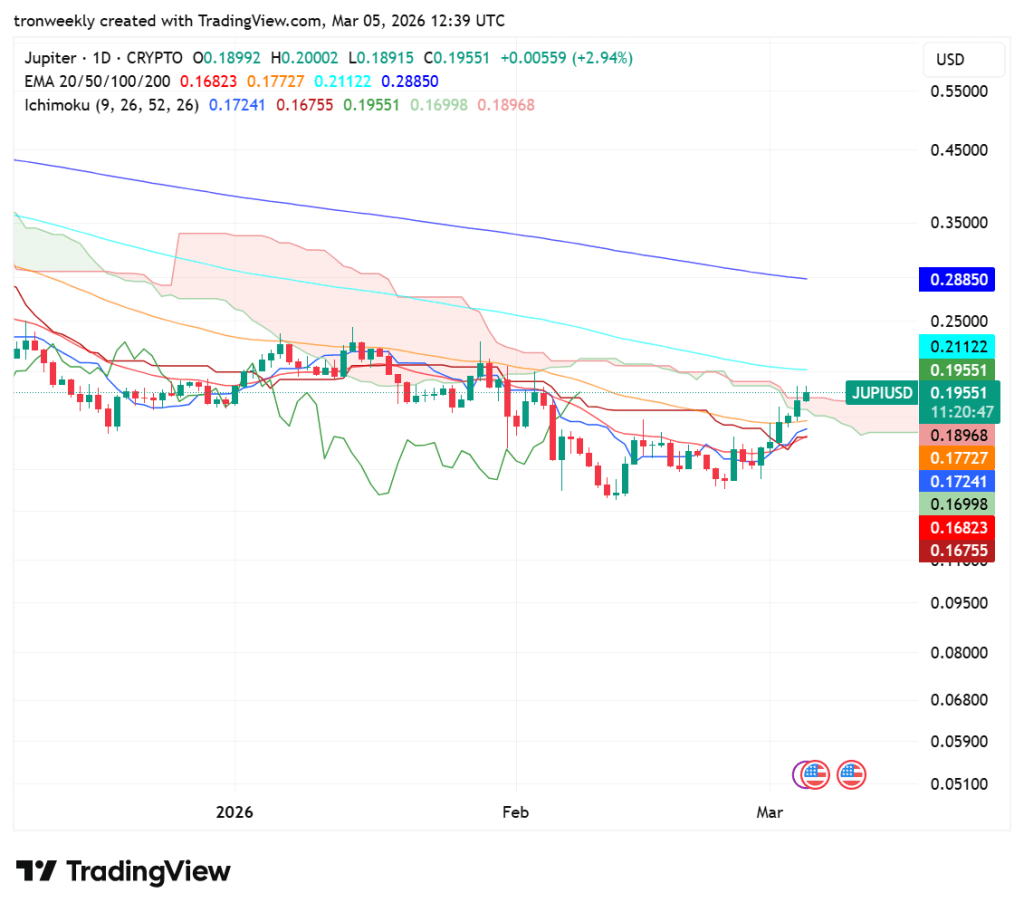
According to TradingView, as of Thursday, March 5, JUP represents a price action where the token is attempting to consolidate after a long period of decline.
The price, currently trading at approximately $0.1955, has immense resistance from its 100-day EMA, which is currently at $0.211.
Though the price has recovered from its February lows, the presence of lower highs implies that the price still has to break free from its overhead resistance to confirm a trend reversal.
Source: TradingView
The Ichimoku Cloud suggests that the market is in a state of neutrality with a slight lean towards the bears, as the price is struggling to break out of the Kumo. There are support bases at the 20-day EMA and the 50-day EMA, in the range of $0.168 and $0.177.
A close above the $0.21 price level on the daily charts is needed for the market to start showing signs of a bullish run towards the 200-day EMA.
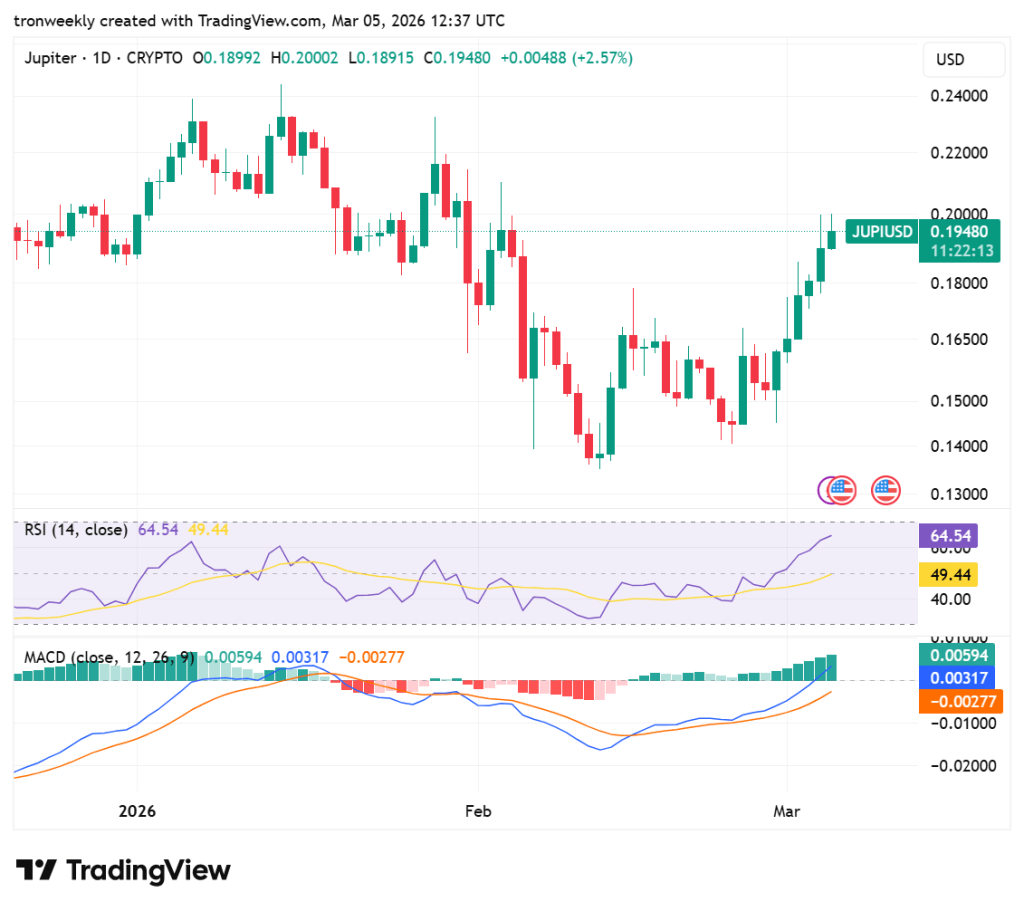
Momentum Indicators Point to Strong Bullish Reversal
The RSI is at 64.54, and it is showing a good bullish trend as it continues to rise towards the overbought level of 70. The rising trend is a sign that the market is gaining strength from its recent lows in February.
Additionally, since the purple line is above the yellow line at 49.44, it can be expected that there will be a long period of rising trend.
Source: TradingView
This is confirmed by the MACD, which has a clear bull cross as it moves up above the orange line. Both lines are trending upwards into positive territory at 0.00594 and 0.00317, respectively.
The increasing height of the teal histogram bars indicates that the upward momentum is accelerating, suggesting that this rally has a strong technical base to continue moving upwards.
Also Read: Jupiter’s Critical $0.15 Support May Trigger $1.50 Rally