

Ethereum is currently near the price zone that has often reflected cycle lows for the asset, as can be identified from the chart provided by crypto analyst Ali Martinez on X, on March 5, 2026.
The on-chain data from Glassnode suggests that the price of Ethereum is approaching the lower end of the MVRV bands, an area that has often reflected cycle lows for the asset.

Source: X
Ethereum Tests Key MVRV Support
The chart plots the market price of Ethereum relative to different bands calculated using the Market Value to Realized Value (MVRV) ratio, which is a metric that helps in determining whether the asset is trading above or below its cost value.
On the upper side of the chart, we can see that higher valuation bands are present around $7,577 and $5,683, which shows that these are the levels where the asset was seen to be highly overvalued in a rising market.
At the same time, the lower valuation bands are positioned around the levels of $2,367 and $1,894, which have been viewed as deeply discounted levels for Ethereum in the past.
As per this analysis, the current trend of Ethereum is moving close to this lower band region. In the past, this kind of trend was seen before the market started to move up.
On the above graph, the periods in the past when the price of ETH was trading close to or lower than this level have been marked in green, which shows a trend reversal in the long term.
However, it is worth noting that MVRV bands are used as a reference rather than a timing signal. This model compares the value of an asset to the average value at which coins were moved on a chain, grouping it into zones that have been seen across multiple cycles.
Ethereum Wave Structure Signals Further Upside
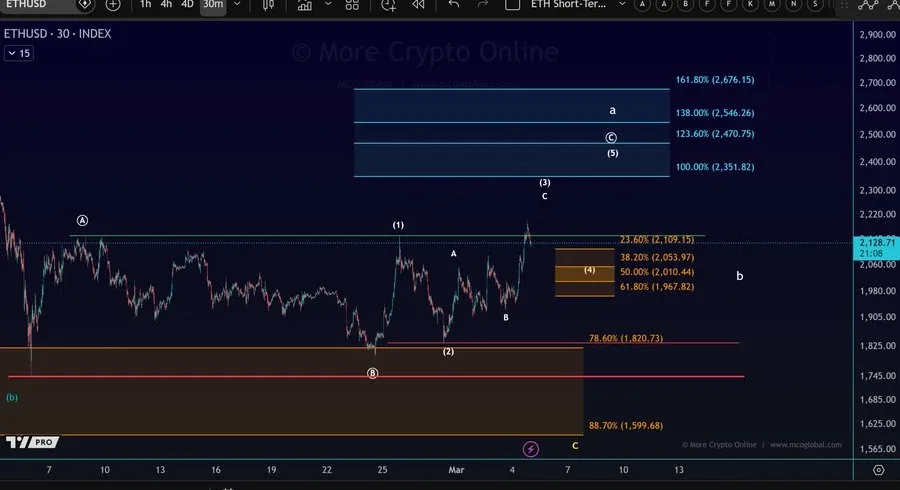
Another perspective is highlighted by the crypto analysis platform More Crypto Online, which has provided the updated Elliott Wave structure for Ethereum.
The 30-minute chart of the ETH/USD pair suggests that the price is still in the process of moving in the wave 3 structure. According to the analysis, the wave C of wave 3 may not be completed yet, implying that the price may move higher before the correction starts.
Source: X
As per the Fibonacci extension levels, the chart has marked various potential price levels for the completion of the move on the upside. The price levels have been marked at $2,351, $2,470, $2,546, and $2,676.
Also Read | XRP Stalls Near $1.49–$1.51 Resistance as Momentum Remains Weak
Ethereum Eyes Wave Four Pullback
Following the completion of the current rising wave’s potential, the analysis predicts a wave (4) correction. According to Fibonacci levels, the price may touch the levels of $2,109, $2,053, $2,010, and $1,967 as a correction.
In the case where the correction is deeper, there are further support levels indicated around $1,820 and $1,599.
From the above analysis, it is clear that the MVRV value bands and the Elliott wave pattern indicate that Ethereum is likely at a critical juncture in its price movement, and analysts are keeping a watch on the potential upside and support levels in the near term.
Also Read | Bitcoin Cash (BCH) Edges Toward $465 as Bulls Eye $500