

Fetch.ai (FET) is showing early signs of a potential trend reversal on Saturday, March 7, after consolidating near a key support level at $0.14595.
The crypto analyst Nehal highlighted that declining volatility and liquidity compression suggest accumulation may be underway, a condition that often precedes strong price movements as pressure builds within a tightening range.
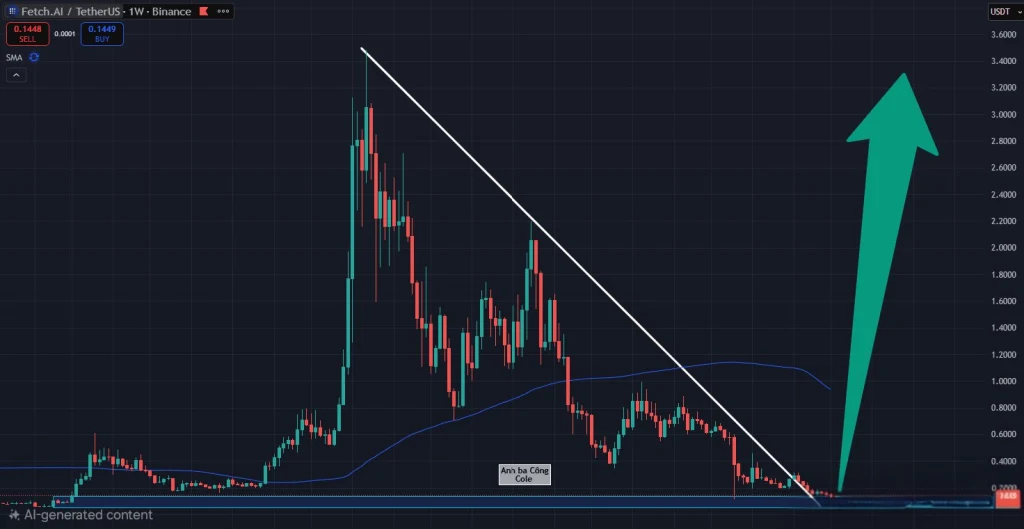
Source: Nehal’s X Post
Traders are watching closely for a confirmed breakout above resistance, which could reopen the path toward new all-time highs beyond $3.40.
Growing interest in artificial intelligence within the crypto sector may also strengthen the long-term outlook. If momentum continues to build, 2026 could become a pivotal year for AI-focused blockchain projects like Fetch.ai.
Also Read: FET Descending Resistance Break Could Send Price to $0.24 Zone
FET Technical Outlook Reveal Bearish Pressure
According to TradingView, as of Saturday, March 7, FET is indicating short-term bearish momentum, as prices have been stagnant around the $0.14595 support level.
The Ichimoku Cloud is above the current candles, acting as a key resistance area, while the Tenkan-sen and Kijun-sen lines have a bearish slope, indicating that sellers have control of prices.

Source: TradingView
The volatility has compressed as the price clings to the lower band at $0.14230, suggesting a phase of exhaustion from the recent sell-off.
To start a reversal, the price has to close above the 20-period SMA at $0.15088. Until the price breaks above the middle band, the short-term outlook remains defensive.
Momentum Indicators Point to Consolidation Phase
Currently, the Relative Strength Index (RSI) stands at 39.71, indicating a bearish zone for the token. As long as the token stays below the signal line of 43.88, the selling pressure will continue.
Though the relative strength index (RSI) has not yet touched the oversold zone of 30, the falling trend indicates a lack of buying power.
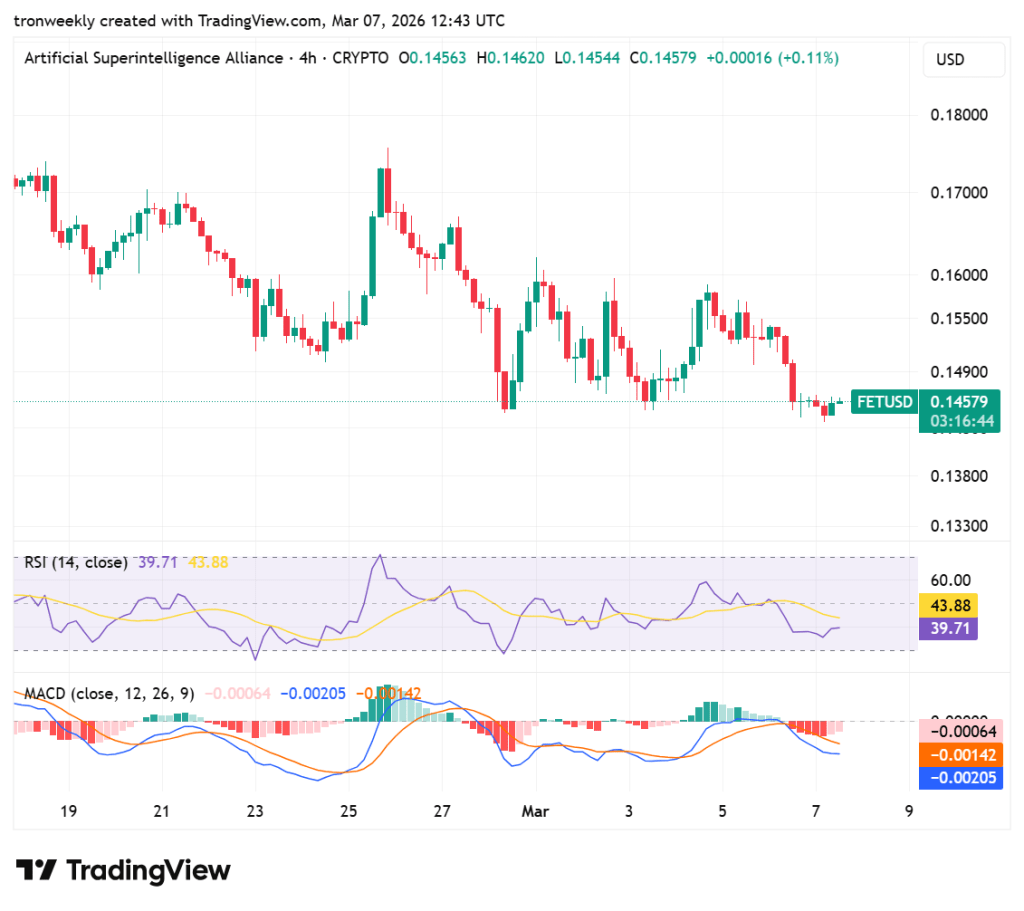
Source: TradingView
Additionally, the MACD indicator shows bearish momentum, as evidenced by the crossing of the blue line, which was at -0.00205, below the orange signal line, thus creating a signal for selling.
The expanding bars of the red histogram also indicate that the price may continue going down until a bullish crossover occurs.
Also Read: FET Tests Critical Support: Is a Rally Toward $2 on the Horizon?