

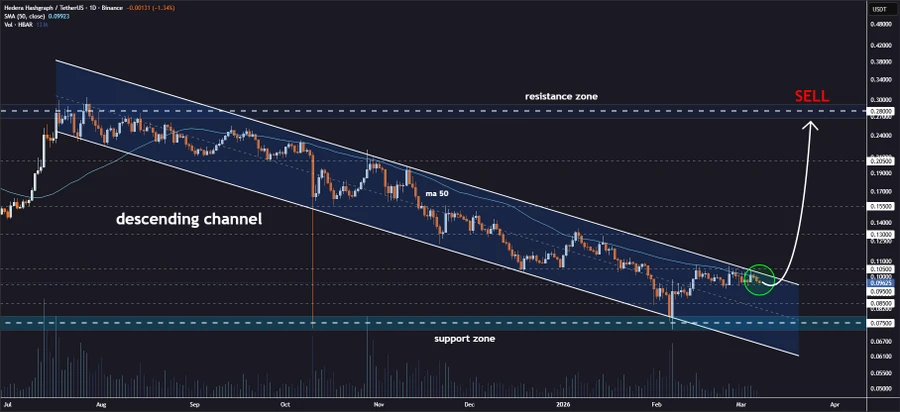
Hedera (HBAR) is at a technical decision point as the price approaches the upper end of a descending channel formation on the daily chart. Analysts indicate that the formation is likely to undergo a test of a breakout, which could define the next phase.
As of writing, on Saturday, Hedera (HBAR) is trading at $0.09591, showing a 1.76% decline in a day, according to CoinMarketCap. The trading volume is down by 36.5% and is currently standing at $61.81 million. Over the last week, the HBAR coin price has decreased by 0.75%.
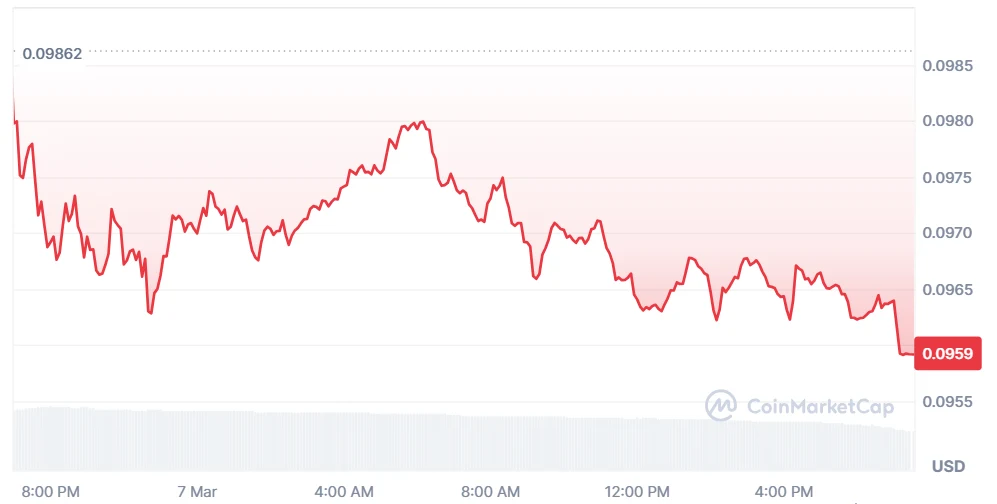
Source: CoinMarketCap
HBAR Tests Key Resistance as Breakout Signals Emerge
HBAR’s price structure is being closely monitored by analysts. Crypto analyst Jonathan Carter highlighted that the asset is nearing a possible descending channel breakout on the daily time scale. It is moving towards the upper end of the pattern.
The descending channel has been in place for several months. The analyst said that the breakout zone is being tested. This is a common area where important decisions are being made in the market.
A successful breakout in the token’s price might indicate a change in market direction. Carter said that trend reversal indicators are being seen. Momentum indicators are showing that pressure is building.
If the breakout occurs, several price targets have been set. The analyst has outlined price targets at $0.105, $0.130, $0.155, $0.205, and $0.280. These are stages of growth for the token price if the breakout occurs and the price keeps rising.
Source: X
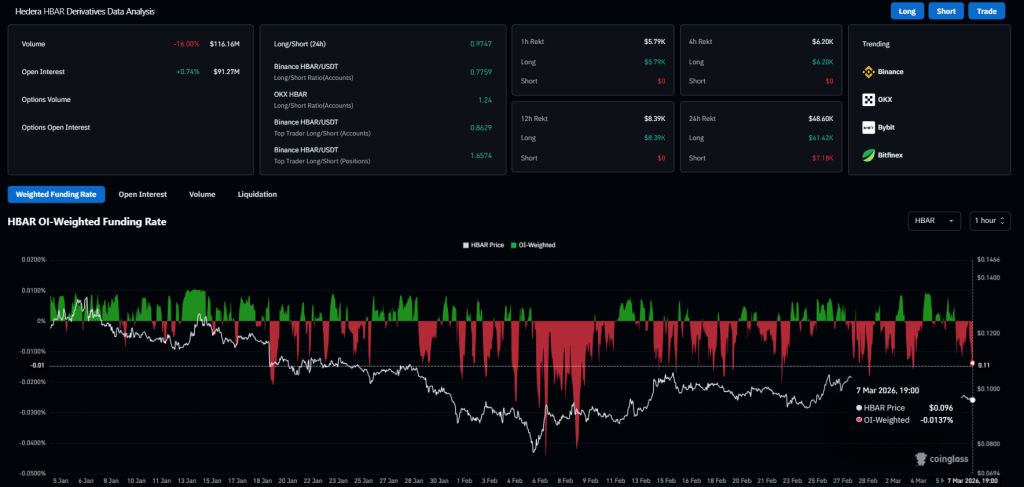
Futures Volume Falls as Open Interest Edges Higher
According to CoinGlass data, the future volume of HBAR has reduced by 16% to $116.16 million. However, the open interest has increased by 0.74% to $91.27 million.
Funding data also reflects current trader sentiment. The OI-weighted funding rate is -0.0137%. A negative rate means that short traders are paying funding to long traders.
Source: CoinGlass
Also Read: Hedera Weekly Rally in Sight: HBAR Price Targets $0.12463 Amid Market Recovery
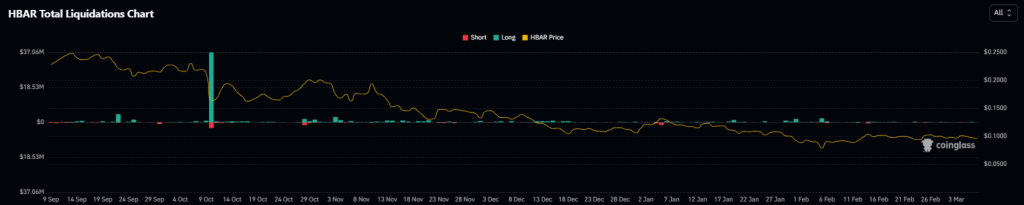
In the past 24 hours, the liquidation data indicates a low level of activity. The total liquidation value is $48.60K. The liquidation for long positions totaled $41.42K, while the short positions amounted to $7.18K.
Source: CoinGlass
RSI and MACD Signal Weak Bearish Momentum
The technical indicators show the current market balance. The Relative Strength Index (RSI) for the daily chart is 46.02, while the RSI moving average stands at 49.31.
When the RSI is below 50, the market is considered to have mild bearish momentum. However, the indicator is close to the 50 level. This indicates that the market is not controlled by either the buyers or the sellers.
The Moving Average Convergence Divergence (MACD) indicator also shows a weak level of momentum. The MACD line is at -0.00032, while the signal line is at -0.00030. The histogram is at -0.00002. This shows a weak negative divergence.

Source: TradingView
These values of the MACD show weak bearish pressure. The small difference between the MACD line and the signal line shows slowing momentum. Traders often monitor this setup for possible changes in market direction.
Also Read: Polkadot Holds $1.40 Support as Descending Channel Signals Bounce