

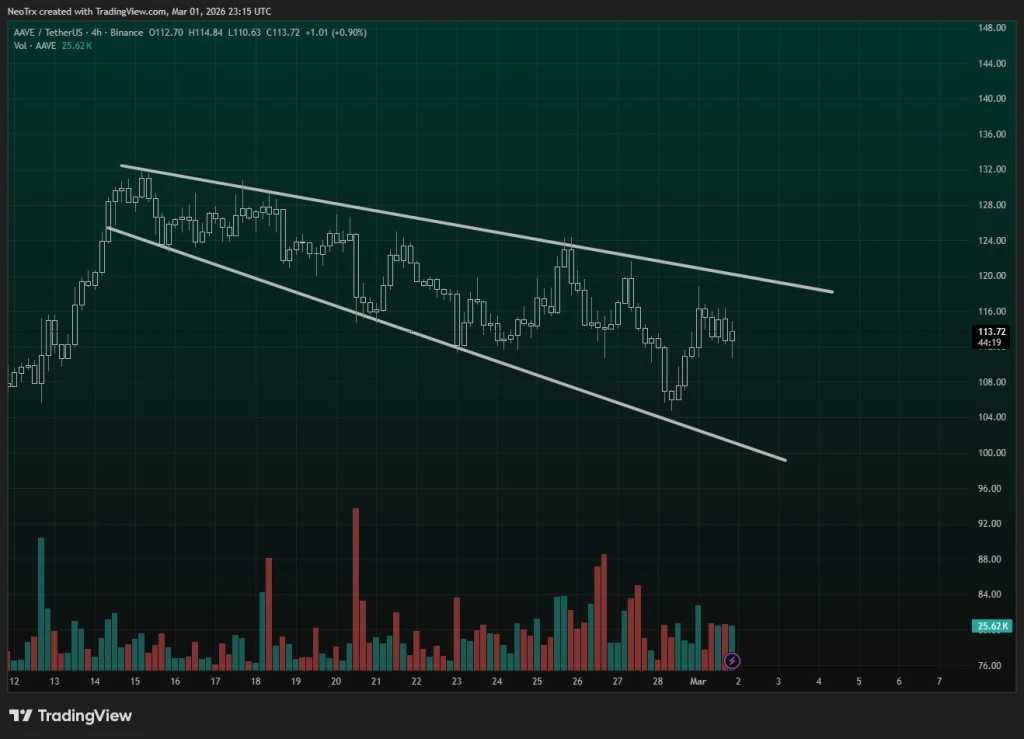
Aave (AAVE) appears to be trading within a descending broadening wedge formation on the four-hour chart, according to the crypto analyst Alpha Crypto Signal.
It’s currently above a crucial support level around the $100 mark, approaching a resistance level around the $125 mark, reflecting expanding volatility and a potential technical inflection point.
The expanding formation indicates the continuation of the distribution process, which means sellers are in control of the price movement in the short term.
The attempts made by the price to rise have not gone beyond the upper level, which confirms the bearish view. The price movement is being closely monitored by traders based on the moderate volume traded during the sessions.
Also Read: Aave’s Explosive $1 Trillion DeFi Milestone
AAVE Price Could Rally to $132 on Confirmed Breakout
If a breakout above the upper descending trendline is confirmed, accompanied by healthy volume, then the current bearish setup would be invalidated.
This might result in a further surge in price, which might eventually target the $125 to $132 region, where supply levels might be a problem again.
Source: Alpha Crypto Signal X Post
Until that breakout occurs, the downside risks remain active within the widening range. If the price fails to regain the resistance level, the pressure on the price will continue, with the lower end of the range around the $100-$104 band possibly acting as a magnet for the price.
If the price falls below this band, it could accelerate the decline, which could be a continuation of the corrective phase.
Momentum Indicators Show Neutral to Bullish Outlook
According to TradingView, the RSI (14) is currently at 51, slightly above the midpoint, which is considered to be neutral to slightly bullish.
It is not in an overbought or oversold condition, as it is still within the 30-70 zone. The RSI has just crossed its signal average, which is considered to be improving, but it is still moderate.

Source: TradingView
The MACD indicator (12, 26, 9) is showing early signs of bullish momentum. The MACD line is rising above the signal line, and the colors of the MACD indicator have changed to green, meaning that the momentum is increasing. Although the momentum is rising, it is still low, suggesting that the trend is still forming.
Also Read: AAVE Faces Brutal 45% Drop, 20% Surge Ahead