
Solana (SOL) could climb nearly 90% to $425 as technical indicators like a golden cross and cup-and-handle pattern align with rising optimism over a potential ETF approval, according to the analyst Lark Davis. But can these factors together really push SOL that high? Let’s break it down.
Solana’s Long-Term Chart Builds a Case for a Big Run
Crypto market analyst Lark Davis believes Solana’s long-term chart is showing one of the most optimistic structures — a cup-and-handle pattern. This formation looks like a deep “U” shape followed by a short downward dip — the “handle.” Traders usually read it as a sign that selling pressure has faded and buyers are preparing for a major breakout.
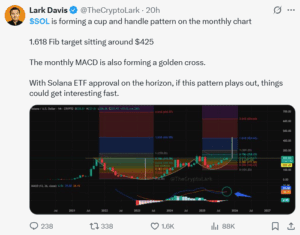
Davis says this structure has been forming on Solana’s monthly chart. This makes it more meaningful than the smaller patterns often seen on daily timeframes. Using Fibonacci extension levels, a common tool to project price targets, he estimates the next key level — the 1.618 extension — sits near $425. That’s about 90% higher than Solana’s current trading price around $223.
He also points to a golden cross forming on Solana’s monthly MACD indicator. This is a sign that long-term momentum may be turning positive. Davis added that an upcoming Solana ETF decision in the U.S. could act as the spark that confirms this move.
ETF Filings Face October Deadline Amid Heavy Institutional Positioning
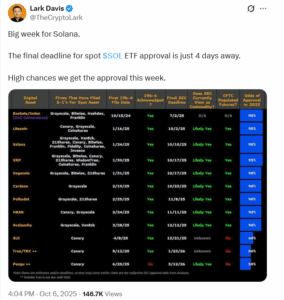
The timing behind Davis’s call is important. The U.S. Securities and Exchange Commission (SEC) is reviewing several spot Solana ETF applications from major firms such as VanEck, 21Shares, and Bitwise. Some proposals include staking features. Staking features allow funds to earn yield from network participation — something that could make Solana ETFs stand out from other crypto products.
Under the SEC’s new generic listing rules, crypto ETFs can now be approved faster. The new rules could cut review times from months to weeks. Regulators are expected to announce decisions between Oct. 10 and 16, and prediction markets currently give over 95% odds of at least one approval.
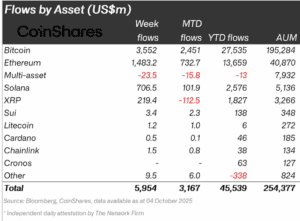
If that happens, institutional investors would gain a regulated way to gain exposure to Solana — similar to how Bitcoin and Ethereum ETFs opened the door for mainstream funds earlier this year. Already, Institutional positioning has already started. Solana-based exchange-traded products recorded $706 million in weekly inflows in early October, pushing total AUM for Solana ETPs past $5.1 billion — the highest on record.
ETF approval would make Solana more accessible to institutional investors, but it doesn’t automatically trigger an immediate price surge. When Bitcoin and Ethereum ETFs were approved, both experienced short-term volatility before stabilizing as inflows accumulated over weeks.
However, much of the optimism surrounding Solana’s ETF is likely already priced in, meaning the token could see a temporary pullback or consolidation after approval.
Data Shows Solana’s Network Running Near Full Capacity
Solana’s network fundamentals remain one of its strongest points. Data from Solana Explorer shows about 546 million SOL in circulation, roughly 89% of the total supply. More than 416 million SOL, around 68%, is currently staked with validators. There is almost no delinquent stake recorded.
That high staking rate signals strong user participation and confidence in the network’s stability. These are factors that often attract long-term investors.
The broader backdrop also supports Davis’s bullish case. Cooling inflation in the United States and growing expectations of Federal Reserve rate cuts have fueled appetite for risk assets like tech stocks and cryptocurrencies.
$425 if Momentum Returns, $200 if Support Breaks
Solana’s daily chart shows a well-defined ascending channel that has guided the token’s recovery since early 2025.
SOL Price is now trading near $223, down about 2.4% on the day, after failing to hold above the mid-channel zone near $230–$235.
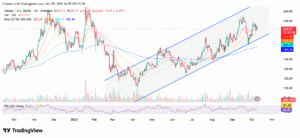
All four key moving averages — the 20-, 50-, 100-, and 200-day EMAs — slope upward, confirming that the long-term trend remains bullish. The 20-day EMA at $223 has turned into an immediate short-term support. The 50-day EMA around $214 forms a stronger base just above the channel’s lower boundary near $200.
The RSI near 51 indicates neutral momentum. It means SOL has room to move in either direction depending on the ETF outcome and broader market sentiment.
If Solana closes above $250 with expanding volume, it would mark a confirmed breakout from both the ascending channel’s midpoint and the “handle” of the larger monthly pattern Davis cited. Moreover, the $425 target comes from a long-term Fibonacci projection, not a short-term move. Even with ETF approval, SOL would need to first break $250 and $325 before advancing further. Ultimately, whether Solana reaches $425 will depend on sustained volume growth, institutional inflows, and the broader crypto market’s direction.
Conversely, if prices slip below $214, the next major support sits near $200, where the 100-day EMA and channel base align. A sustained drop under $200 would expose the 200-day EMA at $186, a zone that previously triggered strong rebounds in March and May.