

ASTER is capturing trader attention as its Bollinger Bands tighten, signaling a potential volatility expansion. According to the crypto analyst Ali Charts, Bollinger Bands measure price fluctuations around a moving average, and a squeeze often precedes significant moves.
The narrowing bands suggest the market is in a low-volatility phase, hinting that ASTER could soon experience a strong price swing, attracting speculative interest.
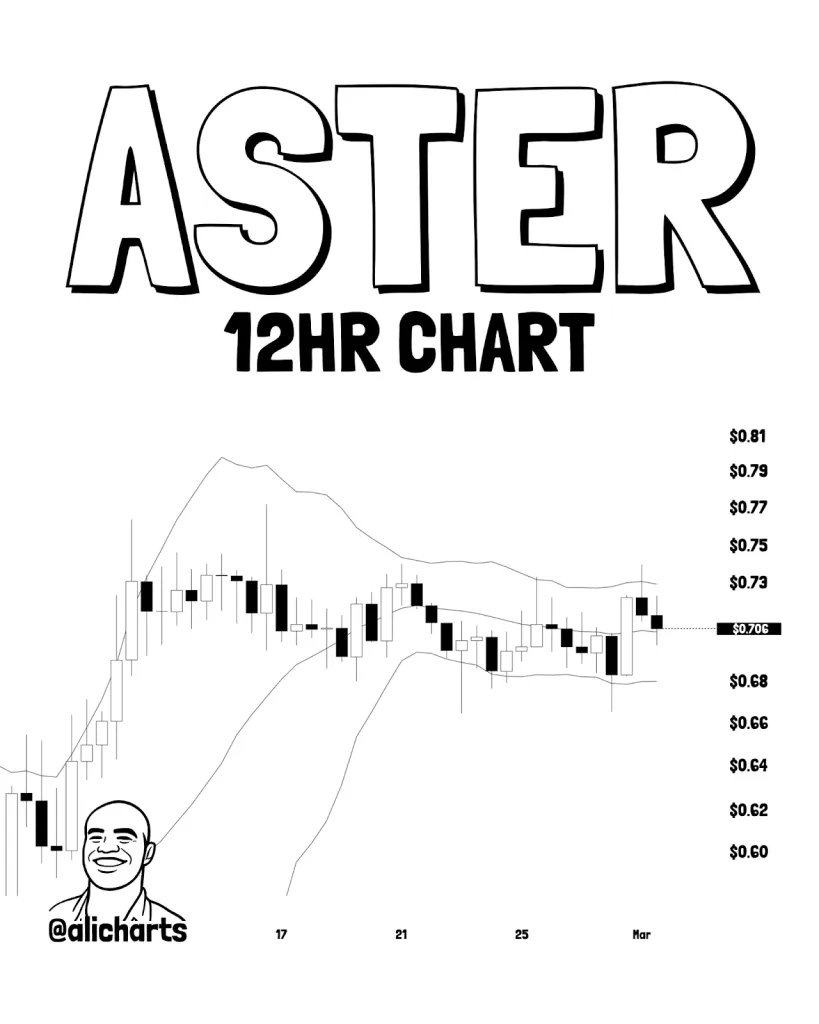
Source: Ali Charts X Post
While the direction of ASTER’s next move remains uncertain, the setup signals heightened trading opportunities. A Bollinger Band squeeze doesn’t predict upward or downward movement, but it often leads to sharp breakouts.
Market watchers are preparing for increased activity, with traders weighing high-risk, high-reward strategies, anticipating that the current calm may soon give way to dynamic price action in the asset.
Also Read: Can Aster Surpass $1.22? Traders Monitor Critical $0.824 Resistance Zone
ASTER Technical Outlook Point to Neutral Momentum
According to TradingView, ASTER displays a transition from a sharp downtrend toward a neutral consolidation phase near $0.71.
After hitting a February low of $0.43, price action is currently stabilizing between the 50-day and 200-day EMAs. This tightening range indicates a cooling of bearish momentum as the market searches for a definitive new direction.

Source: TradingView
From the technical indicators, it can be seen that the Ichimoku cloud has been facing some resistance, with the $0.713 level acting as the point of resistance. In order for the token to show a bullish reversal, it has to be able to break the $0.819.
If it fails to hold the $0.69 support level, it could retrace back to $0.58. The token is still in a cautious state, with the prices highly range-bound.
Momentum Indicators Point to Cautious Optimism
The Relative Strength Index (RSI) is currently at 55.63, which is neutral to bullish. It is still above the 50-mark, which means the buying pressure is still slightly higher.
However, the RSI has flattened out considerably over the last few days in February, which is in line with the sideways movement of the price.
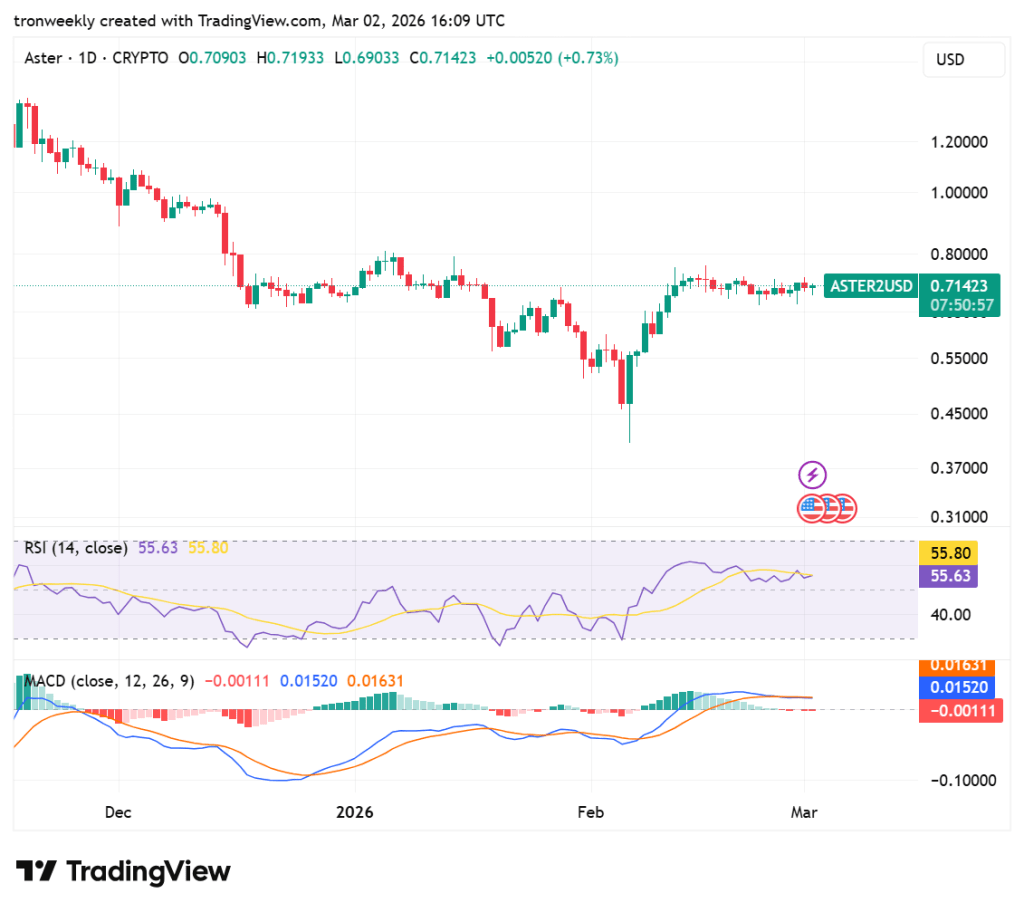
Source: TradingView
The MACD indicator displays the blue line moving towards the orange line, which indicates a declining trend.
As long as the two lines remain above the zero line, which is a bullish signal, the diminishing size of the green bars on the histogram indicates that the buying force is losing steam. This indicates that the asset is consolidating and awaiting a major breakout.
Also Read: ASTER Signals Pullback Toward $0.56–$0.59 Support After Breakout