

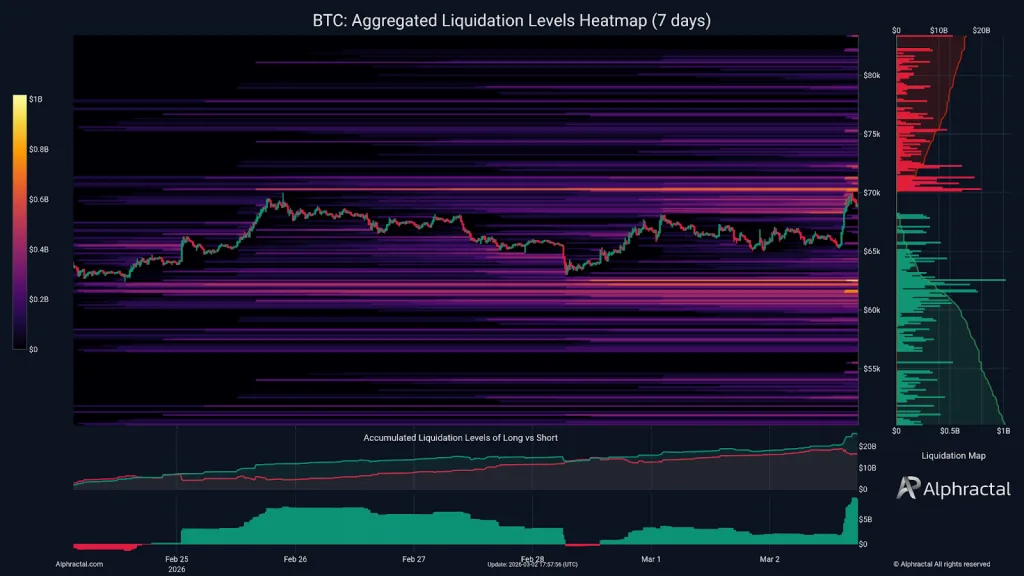
Market data shared by Alphractal on March 3 shows that short positions were heavily liquidated, shifting the short-term balance. The 7-day aggregated liquidation levels have now flipped net long.
This change suggests that bearish pressure has been cleared for now, and positioning is leaning toward buyers.
Source: X
However, the structure is not one-way. There is a liquidation pool of approximately $70,000. This amount may attract traders if the market is searching for liquidity. When there are several stop orders, the price tends to move towards them.
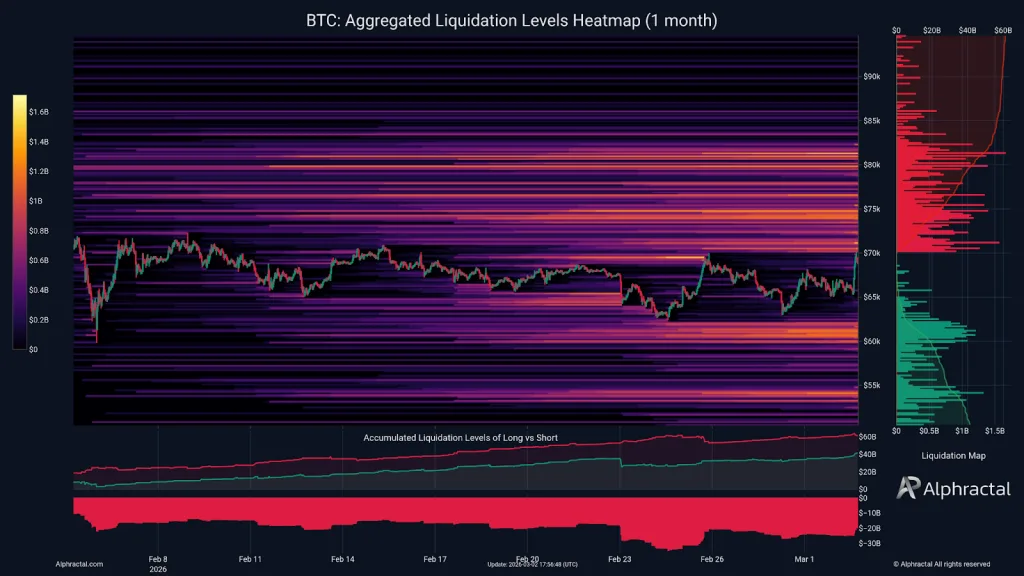
The 30-day view of liquidations reveals more information. There are two large liquidation pools around $61,500 and $54,000. On the other side, large short pools are around $71,000 and $75,000.
Source: X
This indicates that there is liquidity stacked both above and below the market prices. When this happens, markets do not move in random ways very often.
Markets tend to move towards areas with the most orders. The question is not whether Bitcoin will move, but which liquidity pool will be hit first.
Also Read: Bitcoin Price Drops Under $90K Following 16,300 BTC in ETF Outflows
Bitcoin Weekly Channel Support Holds Firm
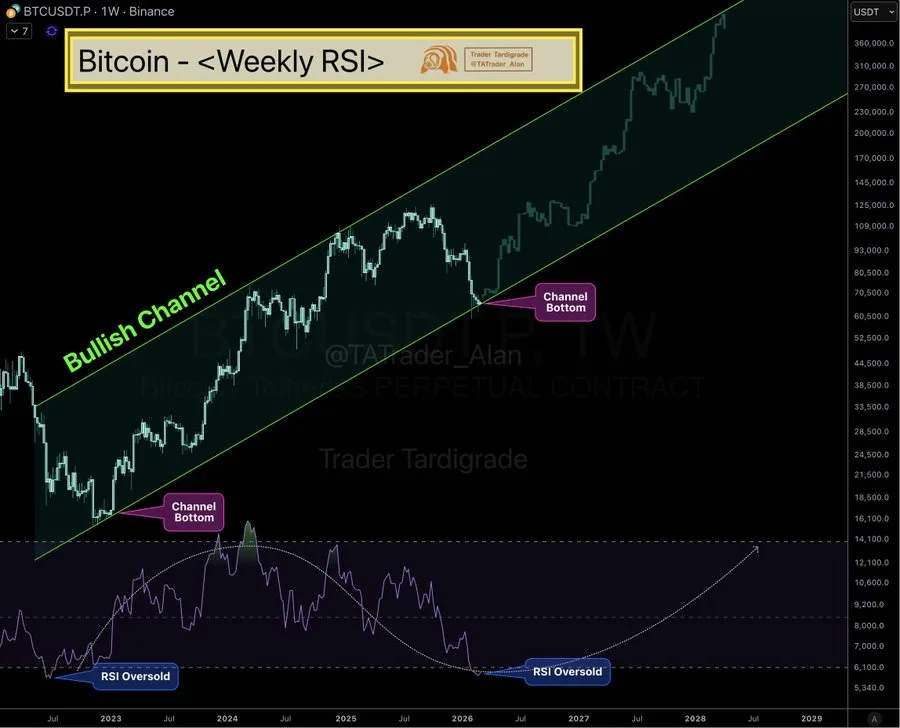
Analysis from Trader Tardigrade separates it. On the weekly chart, Bitcoin is still within the obvious rising channel that has defined its price action for years.
The channel is making higher highs and higher lows. Each major dip has been supported at the bottom of the channel and has continued higher. The latest dip also touched the bottom of the channel and turned higher.
This trend indicates that the larger trend is still on course. The buyers have continued to hold off on the lower trend line, preventing further losses.
As long as the weekly candle remains above the trend line, the larger trend remains valid. A break below the bottom of the channel would render this analysis invalid. For now, the larger scenario is still in favor of a continuation trend.
Source: X
RSI Oversold Level Mirrors Past Rebounds
The momentum indicators bring more information to the table. The Relative Strength Index on a weekly chart has reached the oversold level, which in the past has correlated with major bottoms.
In the past cycles, when the RSI reached similar levels and the price tested the bottom of the channel, Bitcoin later rallied to new highs.
The current RSI configuration is similar to what happened in the past. If the past is prologue, then momentum may slowly return in the coming months.
The chart shows a possible expansion phase, where the price is targeting the top boundary of the channel, which is significantly higher than its current level.
Also Read: Bitcoin Price Analysis: BTC Trades Near $69,000 as Daily RSI Slips Toward 30