Bitcoin spot trading activity has fallen to its weakest level of the year even as a fresh CryptoQuant signal suggests one important pocket of selling pressure may be starting to fade.
Darkfost, a contributor at CryptoQuant, said February is on pace to finish as the month with the lowest Bitcoin spot volumes since the start of 2024. He tied that slowdown to a broader retreat in risk appetite as traders pull back from directional exposure and wait for firmer macro or technical confirmation.
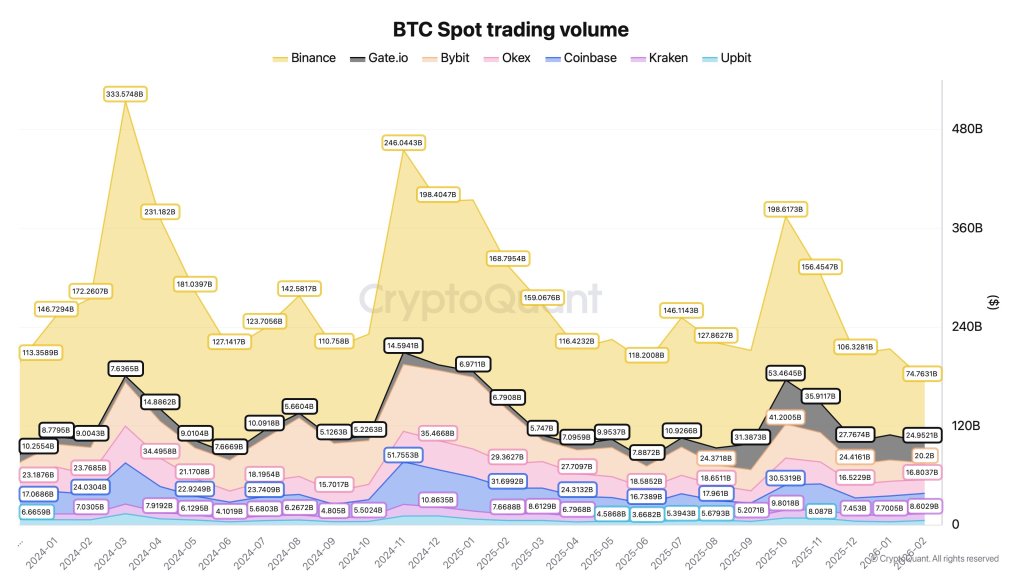
“February is on track to close as the month with the lowest Bitcoin spot trading volumes since the beginning of 2024. This comes alongside BTC’s price revisiting levels last seen in 2024 as well,” Darkfost wrote on X. “The current climate of uncertainty surrounding BTC has pushed investors toward a more defensive stance, resulting in a marked reduction in risk-taking.”
Bitcoin Liquidity Keeps Thinning Out
The scale of the slowdown is visible across the major venues. Darkfost said Binance still leads by a wide margin with nearly $75 billion in February spot volume, ahead of Gate.io at $25 billion and Bybit at $20 billion. Even so, that dominance has not insulated Binance from the broader contraction.
Related Reading
Since Bitcoin’s last all-time high in October, monthly spot volumes have been roughly cut in half across the largest exchanges, according to the post. Binance fell from $198 billion to $75 billion, Gate.io from $53 billion to $25 billion, and Bybit from $41 billion to $20 billion. Rather than an exchange-specific issue, Darkfost framed the move as a market-wide pullback in participation.
He also linked the deterioration in liquidity to the aftermath of the Oct. 10 shock, when open interest dropped by more than 70,000 BTC, or roughly $8 billion, in a sharp reset of leveraged exposure. In his telling, that event did not just hit derivatives positioning. It appears to have accelerated a broader disengagement from crypto trading activity.
“This phase of disengagement is directly reflected in the steady decline in spot trading volumes observed across major exchanges,” Darkfost wrote. “This dynamic points to a generalized trend affecting all major exchanges.”
That matters because spot flows tend to carry more weight when traders are looking for evidence of durable demand rather than fast-moving leverage. A recovery built on stronger spot participation generally looks sturdier than one driven mainly by derivatives.
Coinbase Pressure Shows Signs Of Easing
Against that weak backdrop, CryptoQuant CEO Ki Young Ju pointed to a more constructive short-term signal: “Selling pressure on Coinbase is easing.”
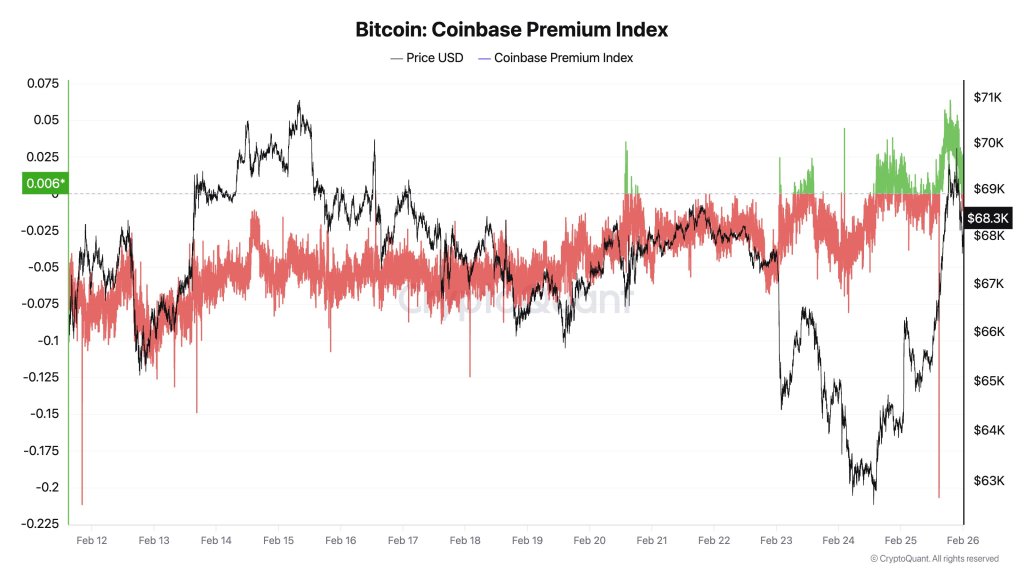
The chart shows the Coinbase Premium Index moving back into positive territory after spending most of the time in February below zero (with a few exceptions). By the latest reading on the chart, the premium had recovered to roughly 0.006 while Bitcoin traded near $68,300. This suggests the discount on Coinbase relative to offshore venues has narrowed, easing one sign of US-led sell pressure.
Related Reading
That does not contradict Darkfost’s broader caution. If anything, the two signals fit together. Spot liquidity remains thin and the market is still operating in a low-conviction environment, but one of the more closely watched measures of immediate selling intensity is no longer deteriorating.
Darkfost was explicit about what would need to change for the picture to improve in a more meaningful way. “As it stands, this simultaneous contraction in spot volumes reflects a structurally cautious market phase, where participants prioritize capital preservation over directional exposure while awaiting clearer macroeconomic or technical signals. For a bullish recovery to materialize, or for a durable bottom to form, stronger spot volume support will be essential.”
For now, that leaves Bitcoin in a familiar late-cycle holding pattern: sellers may be backing off on Coinbase, but without a broader return of spot demand, the market still lacks the depth that usually underpins a stronger move.
At press time, Bitcoin traded at $68,153.
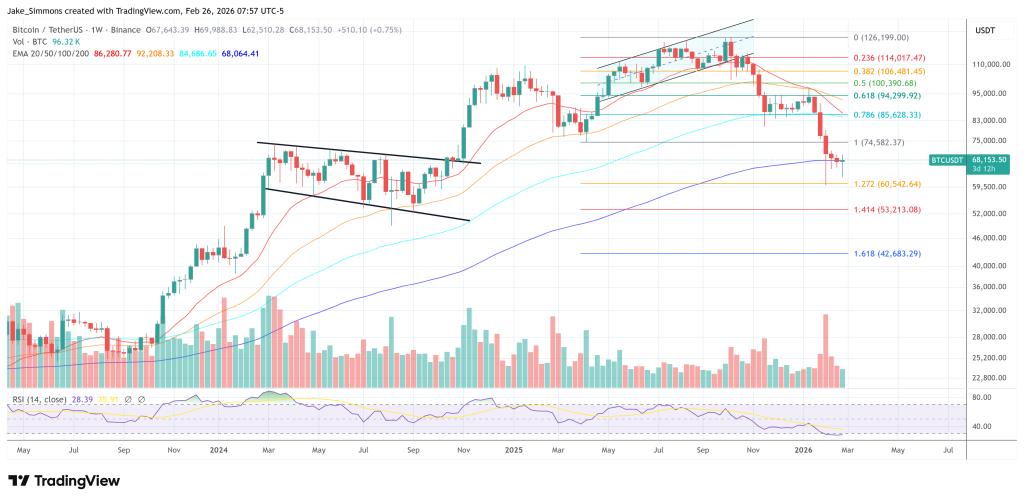
Featured image created with DALL.E, chart from TradingView.com