

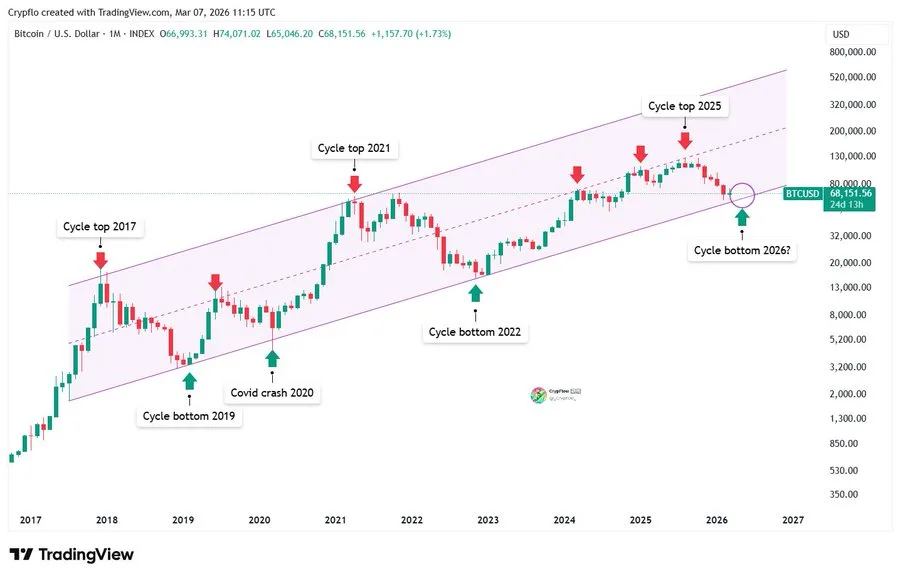
Crypto analyst CrypFlow shared a long-term view of Bitcoin’s price behavior on March 7, pointing to a macro trend channel that has guided the asset’s movement for almost a decade.
From the chart, Bitcoin’s price fluctuates between two parallel trendlines. This was evident during the bull run of 2017, as the price touched the top of these parallel lines, followed by a fall in 2018.
Source: X
The price fell and touched the bottom of these lines in 2019, thus completing a cycle. This pattern reoccurred in later periods. In early 2020, there was a market crash that caused Bitcoin’s price to drop significantly.
However, it remained above the long-term support line. As it started to rise, it initiated a strong rally, and the price reached a high in 2021 at the top of the channel.
In the 2022 bear market, Bitcoin’s price fell, and the cycle’s bottom formed at the lower edge of the channel, demonstrating the strength of long-term support. CrypFlow’s chart shows that the market has been following this major pattern over the years.
Also Read: Bitcoin Price Drops Under $90K Following 16,300 BTC in ETF Outflows
2025 Cycle Peak Stalled Near Mid-Channel Momentum Zone
This latest phase of the cycle appears to differ from the previous peaks. Instead of going to the resistance at the top of the channel, the 2025 high was a halt at the midpoint of the channel, a point often considered a shift from increasing to decreasing momentum.
The lower high to the resistance also suggests that the strength was not as high as the previous cycles, in which the high was more towards the resistance before reversing.
So, after the peak in 2025, Bitcoin continued making lower highs and started moving lower again. If we look at the long-term trend, it seems that the price is again moving towards the lower boundary of the channel.
This has always been a big place for long-term buyers to start buying. So, if things are going the same way, the lower boundary may again be the next big cycle bottom, maybe around 2026.
Bitcoin Short-Term Price Structure Signals Consolidation
Short-term data from TradingView presents an associated but different perspective. On the daily chart for Bitcoin, it is clear that it started its downtrend when it reached around $100,000 earlier this year. Since then, it has been forming lower highs and lower lows.
This was followed by a sharp drop in early February, which accelerated the price drop from the mid-$90,000s to the low $60,000s. This was indicative of heavy selling pressure within the market.
Since then, the market has stabilized within the $63,000 to $70,000 price range. Bitcoin is currently at $67,300, which is around the middle of that range. Technical indicators are also showing mixed signals.
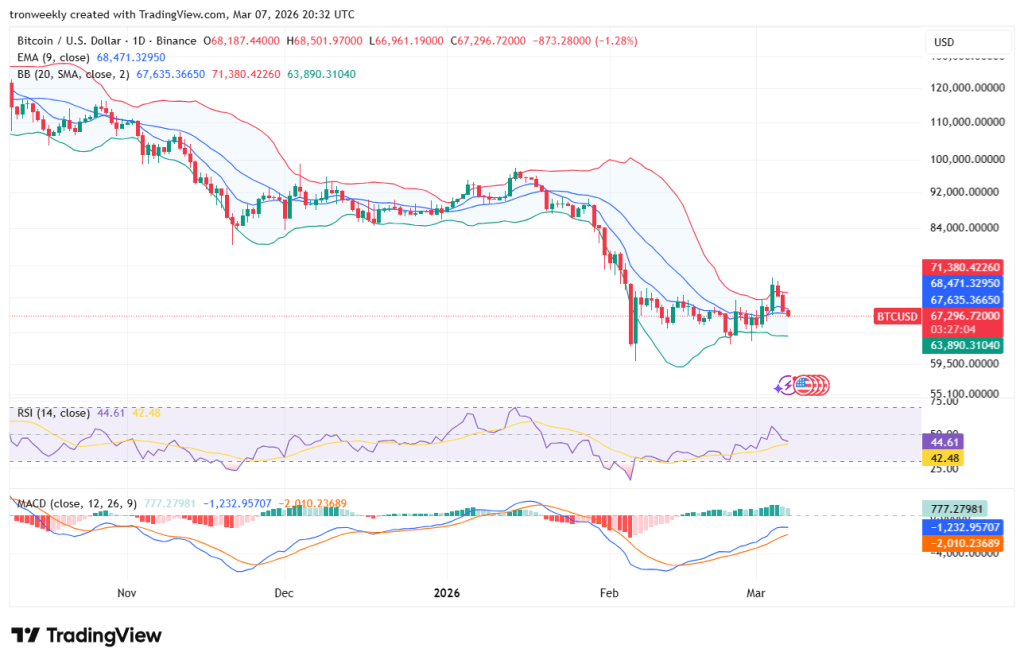
Source: TradingView
The price is still above the 9-period EMA, which is currently trading at about $68,500. Therefore, we can still say that short-term momentum is weak. Also, the RSI is trading at about 44.
Therefore, we can say that selling pressure is still not over. However, we can clearly see that support levels are at about $63,000, and resistance levels are at about $70,000 to $71,000.
If we manage to break these resistance levels, we can easily see prices trading at about $75,000 to $80,000. On the other hand, if we are unable to hold support levels, we can easily see prices trading at about the $58,000 to $60,000 zone.
Also Read: Bitcoin Price Analysis: BTC Trades Near $69,000 as Daily RSI Slips Toward 30