
The REX-Osprey BONK ETF’s registration now targets October 10, 2025 for its next effectiveness step, while Nasdaq-listed Safety Shot said it formed BONK Holdings LLC and executed a $5 million BONK purchase to expand its treasury. Exchange listing notices for a BONK ETF have not appeared, so trading has not begun.
SEC filing sets October 10 for the BONK ETF’s post-effective amendment
The ETF Opportunities Trust filed a Rule 485BXT on September 11 designating October 10, 2025 as the new effective date for a previously filed post-effective amendment that covers the REX-Osprey BONK ETF. The document lists BONK alongside other funds in the trust and specifies the delayed effectiveness under paragraph (b).

This filing updates timing on the fund’s registration paperwork rather than announcing a first trade. It continues the step-wise process typical for 1940-Act crypto products, where the registration can become effective on a future date while separate exchange actions determine when shares actually list.
Meanwhile, no new-listing notice for a BONK ETF appears on Cboe’s public “New Listings” board. Without a posted venue, ticker, and first-trade date, secondary-market trading for a BONK ETF remains pending.
Safety Shot forms BONK Holdings and adds $5 million to its BONK treasury
Safety Shot said on September 11 that it created BONK Holdings LLC to house its digital-asset strategy and that it completed a $5 million BONK token purchase. The company stated the move lifts its BONK treasury above $63 million. The announcement framed BONK as part of a broader corporate-treasury approach.
Follow-on coverage from multiple outlets echoed the claims and timing, citing the $5 million buy and the new subsidiary. These recaps positioned the step as an expansion of Safety Shot’s existing BONK position.
However, some third-party commentary questioned the company’s $63 million valuation figure for its holdings. Safety Shot’s press release remains the primary source for the company’s stated totals.
Tools and infrastructure: BONKbot remains a prominent Solana trading interface
Away from ETF mechanics and corporate treasuries, BONKbot continues to feature in the Solana trading toolkit. The project’s materials highlight a Telegram-based interface focused on fast execution and automation for SPL tokens.
Community resources describe BONKbot’s scale and usage, including lifetime volume and daily activity figures, underscoring its role in BONK’s broader ecosystem. While these dashboards are not regulatory filings, they illustrate how users currently trade around BONK without an ETF.
Independent reviews from the summer also outline the bot’s strengths and constraints, providing additional context on how retail participants access BONK and other Solana assets today.
BONK breaks out of falling wedge; 158% measured move points to 0.00005937
BONK/USDT on the daily chart shows a clean falling wedge that began after the early August peak and narrowed into September. A falling wedge is a bullish reversal pattern formed by two downward-sloping, converging trendlines that often precedes an upside breakout. Price has already pushed above the wedge’s upper boundary; even though it is consolidating around the 50-day EMA near 0.0000233, the bias remains upward.
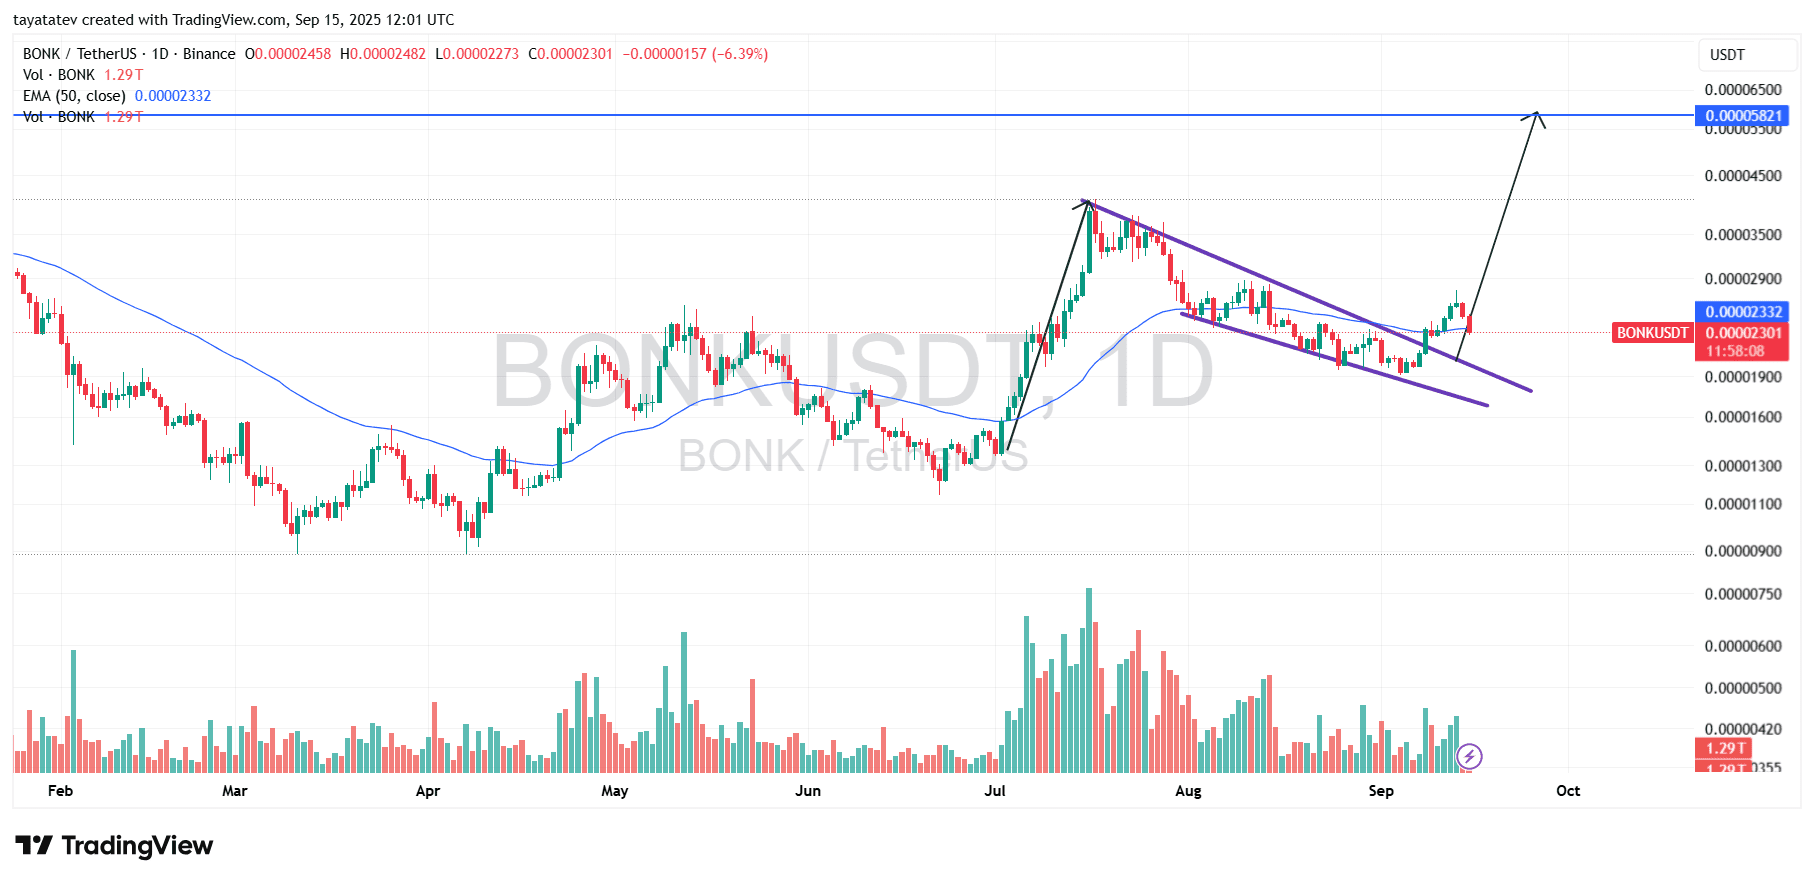
The breakout followed a brisk July–August advance and came with a brief pickup in volume, while subsequent candles show digestion. The current print on the chart is 0.00002301, which sits close to the 50-day average and just above the former wedge ceiling, turning that line into immediate support. As long as price holds this reclaimed trendline, the breakout structure stays intact and the consolidation reads as a pause.
The measured-move projection anchors on the prior impulse leg and the wedge’s depth. From today’s charted close (0.00002301), a 158% advance implies a target at 0.00005937, broadly in line with the overhead resistance band drawn on the chart. Interim checkpoints sit near the late-August swing area and the recent breakout pivot, yet momentum favors a grind higher while candles hold above the wedge top. A decisive daily close back inside the wedge would weaken the setup; otherwise, the path of least resistance points toward the 0.00005937 objective.
RSI turns neutral to positive as momentum rebuilds
BONK daily RSI sits near 49.7 with its RSI moving average around 49.4, showing a marginal reclaim of the 50 line after a September rise from the low 40s. The purple RSI has crossed up through its signal, which indicates improving short term momentum even though conditions remain neutral rather than overbought.
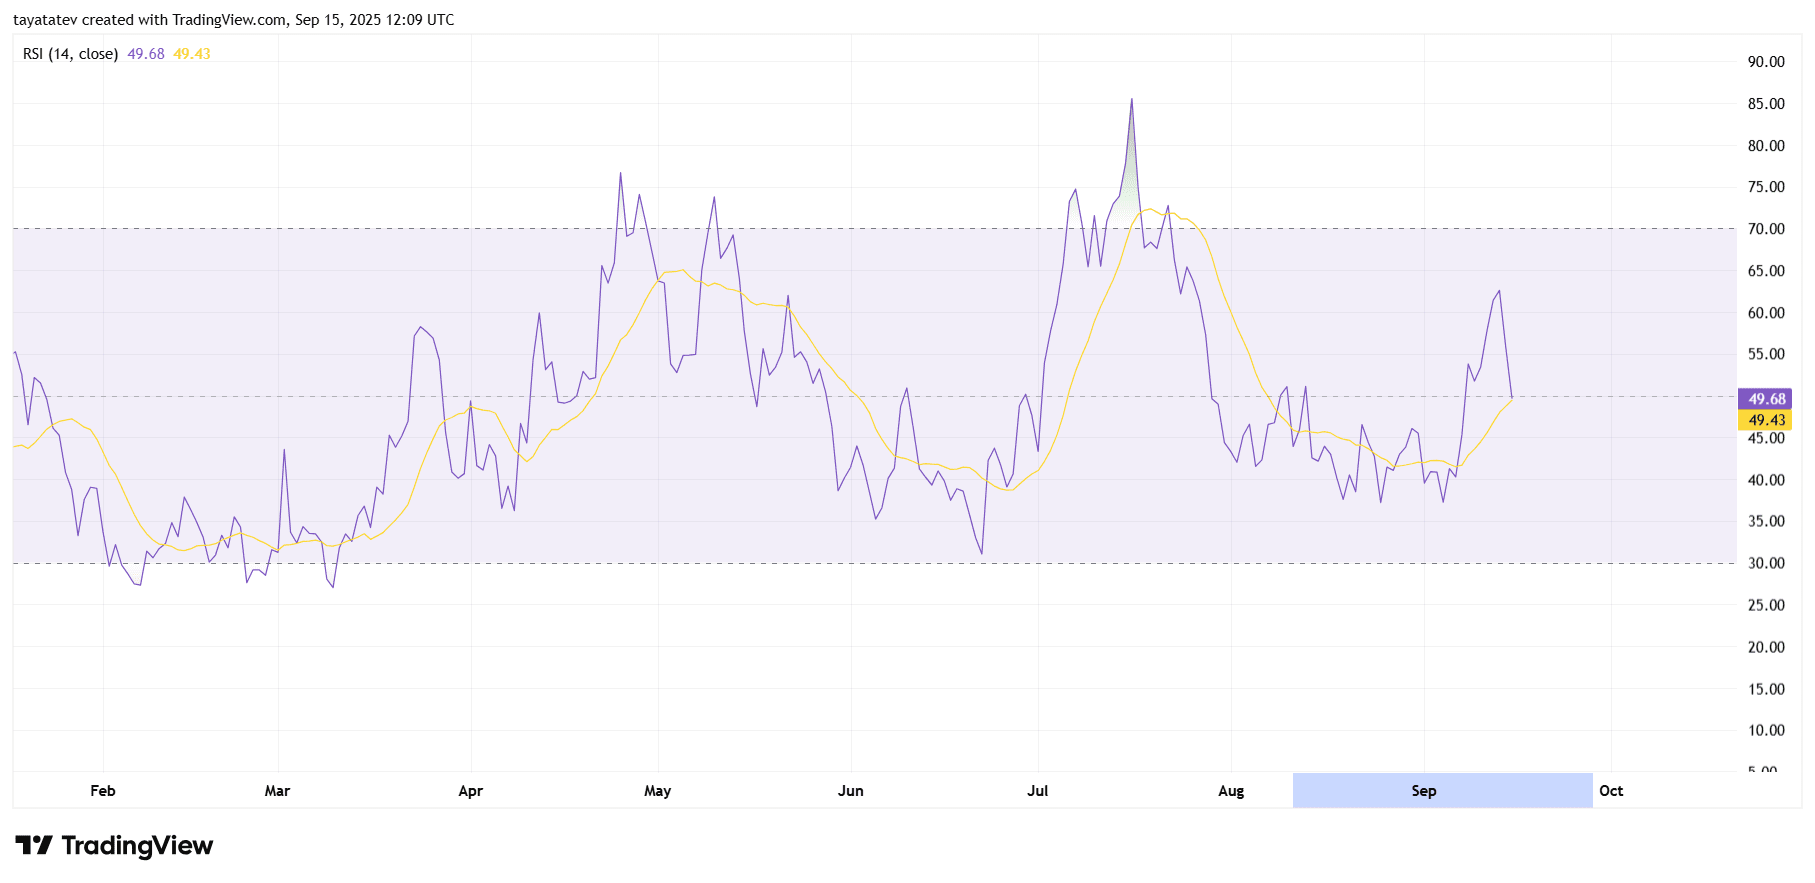
Through July the oscillator spiked toward 90, then cooled in August while price traced a falling wedge. In early September RSI put in higher lows while price based, a common momentum repair that often precedes trend resumption. The latest uptick aligns with the wedge breakout on price and suggests buyers are regaining control.
For confirmation, RSI needs sustained closes above 50 and a push into the 55 to 60 band to show strengthening impulse. If RSI slips back below 45, momentum would fade and the breakout case would weaken. Until then, the RSI profile supports the view that consolidation is corrective inside a rebuilding uptrend.
MACD turns bullish as histogram expands
The BONK daily MACD has crossed above its signal line in early September and now sits on the positive side of the zero line, aligning with the recent breakout on price. The green histogram bars have expanded over the past sessions, which shows momentum accelerating after August’s decline.
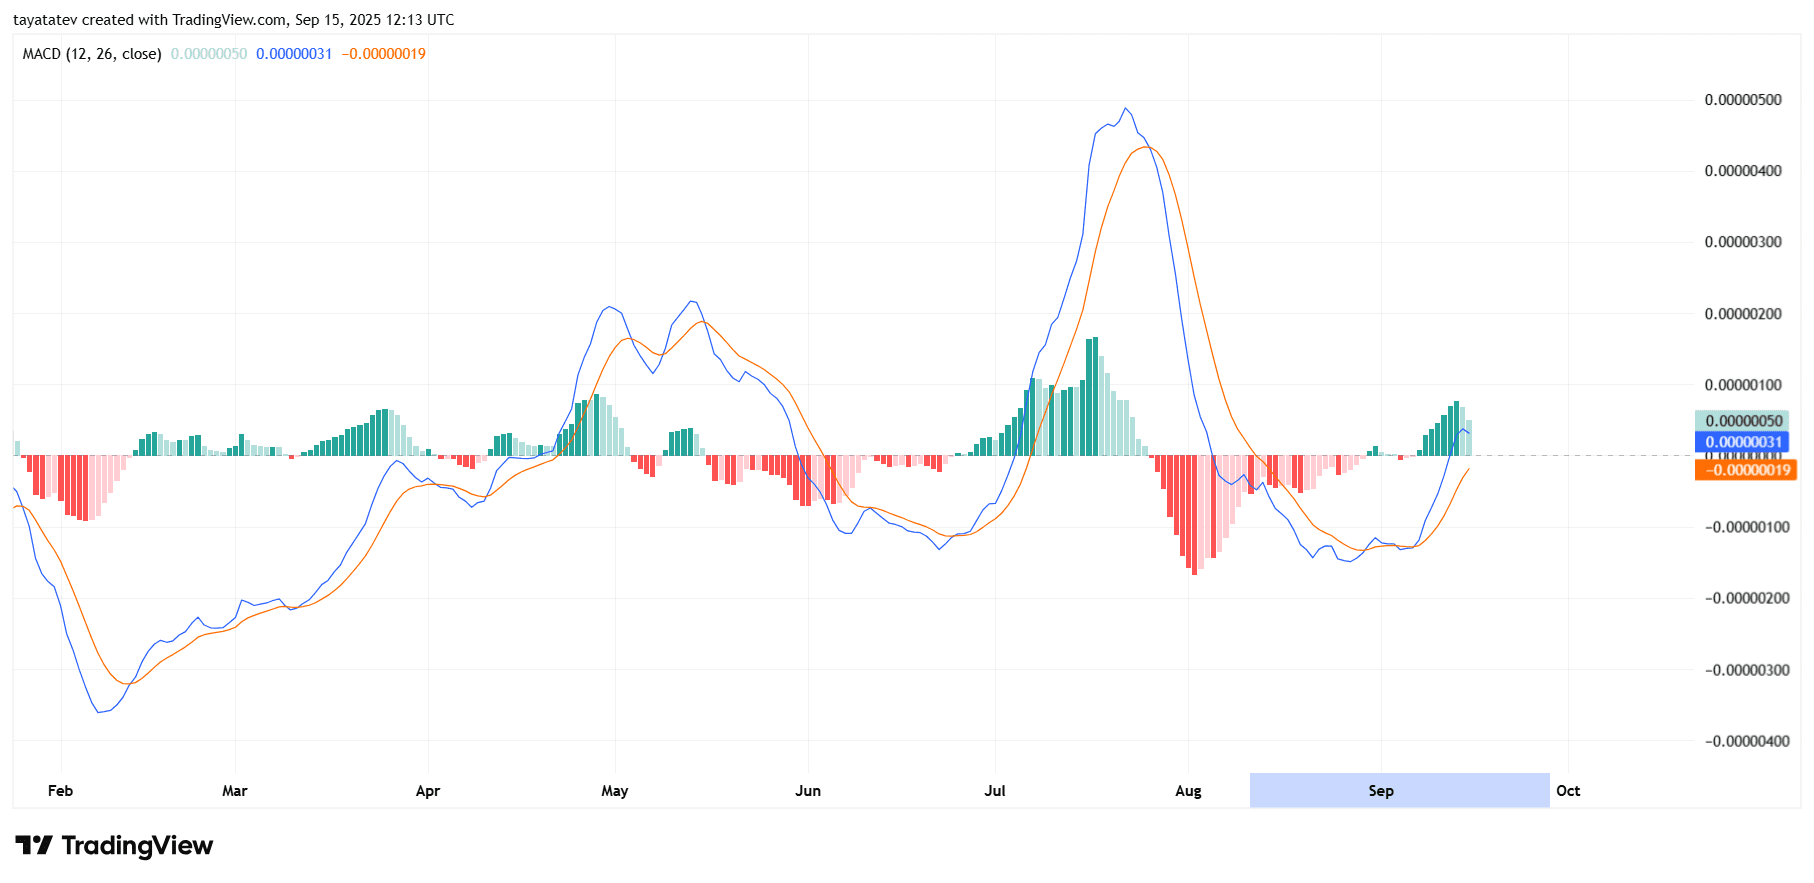
Through July and early August the MACD peaked and then rolled over, producing a bearish cross and a long red histogram run while price traced a falling wedge. Since the start of September the blue MACD line has curled up through the orange signal line, and the histogram flipped green, indicating a shift from contraction to expansion in upside momentum.
From here, sustained bars above zero would confirm trend strength and support further upside follow through on the breakout. Conversely, a narrowing histogram or a new bear cross would signal fading impulse and raise the risk of a deeper pause. For now, the MACD profile reads constructive and consistent with a rebuilding uptrend.