
An analyst on X, Trader Tardigrade, has caught a nice pattern on the Dogecoin chart that could potentially lead to higher prices.
Notably, this pattern shows up at a time when the price action of Dogecoin is trending downward. The meme coin started the week at around $0.27 but has dropped below $0.25 by this writing.
During this press, DOGE is changing hands at $0.2454, down 7.3% in the past 24 hours. However, it is up 6.2% in the past seven days. Amid this short-term decline, an analyst on X, Trader Tardigrade, sees this as a repetition of what happened earlier in late September, when Dogecoin surged to peak at around $0.26.
A Nice Dogecoin Pattern Was Caught
In his commentary, Tardigrade mentions that he caught a “nice” Dogecoin pattern on the 4-hour chart. Specifically, the primary observation is the presence of two attempted rallies that were not successful, with a rising trendline providing support each time the rallies failed.
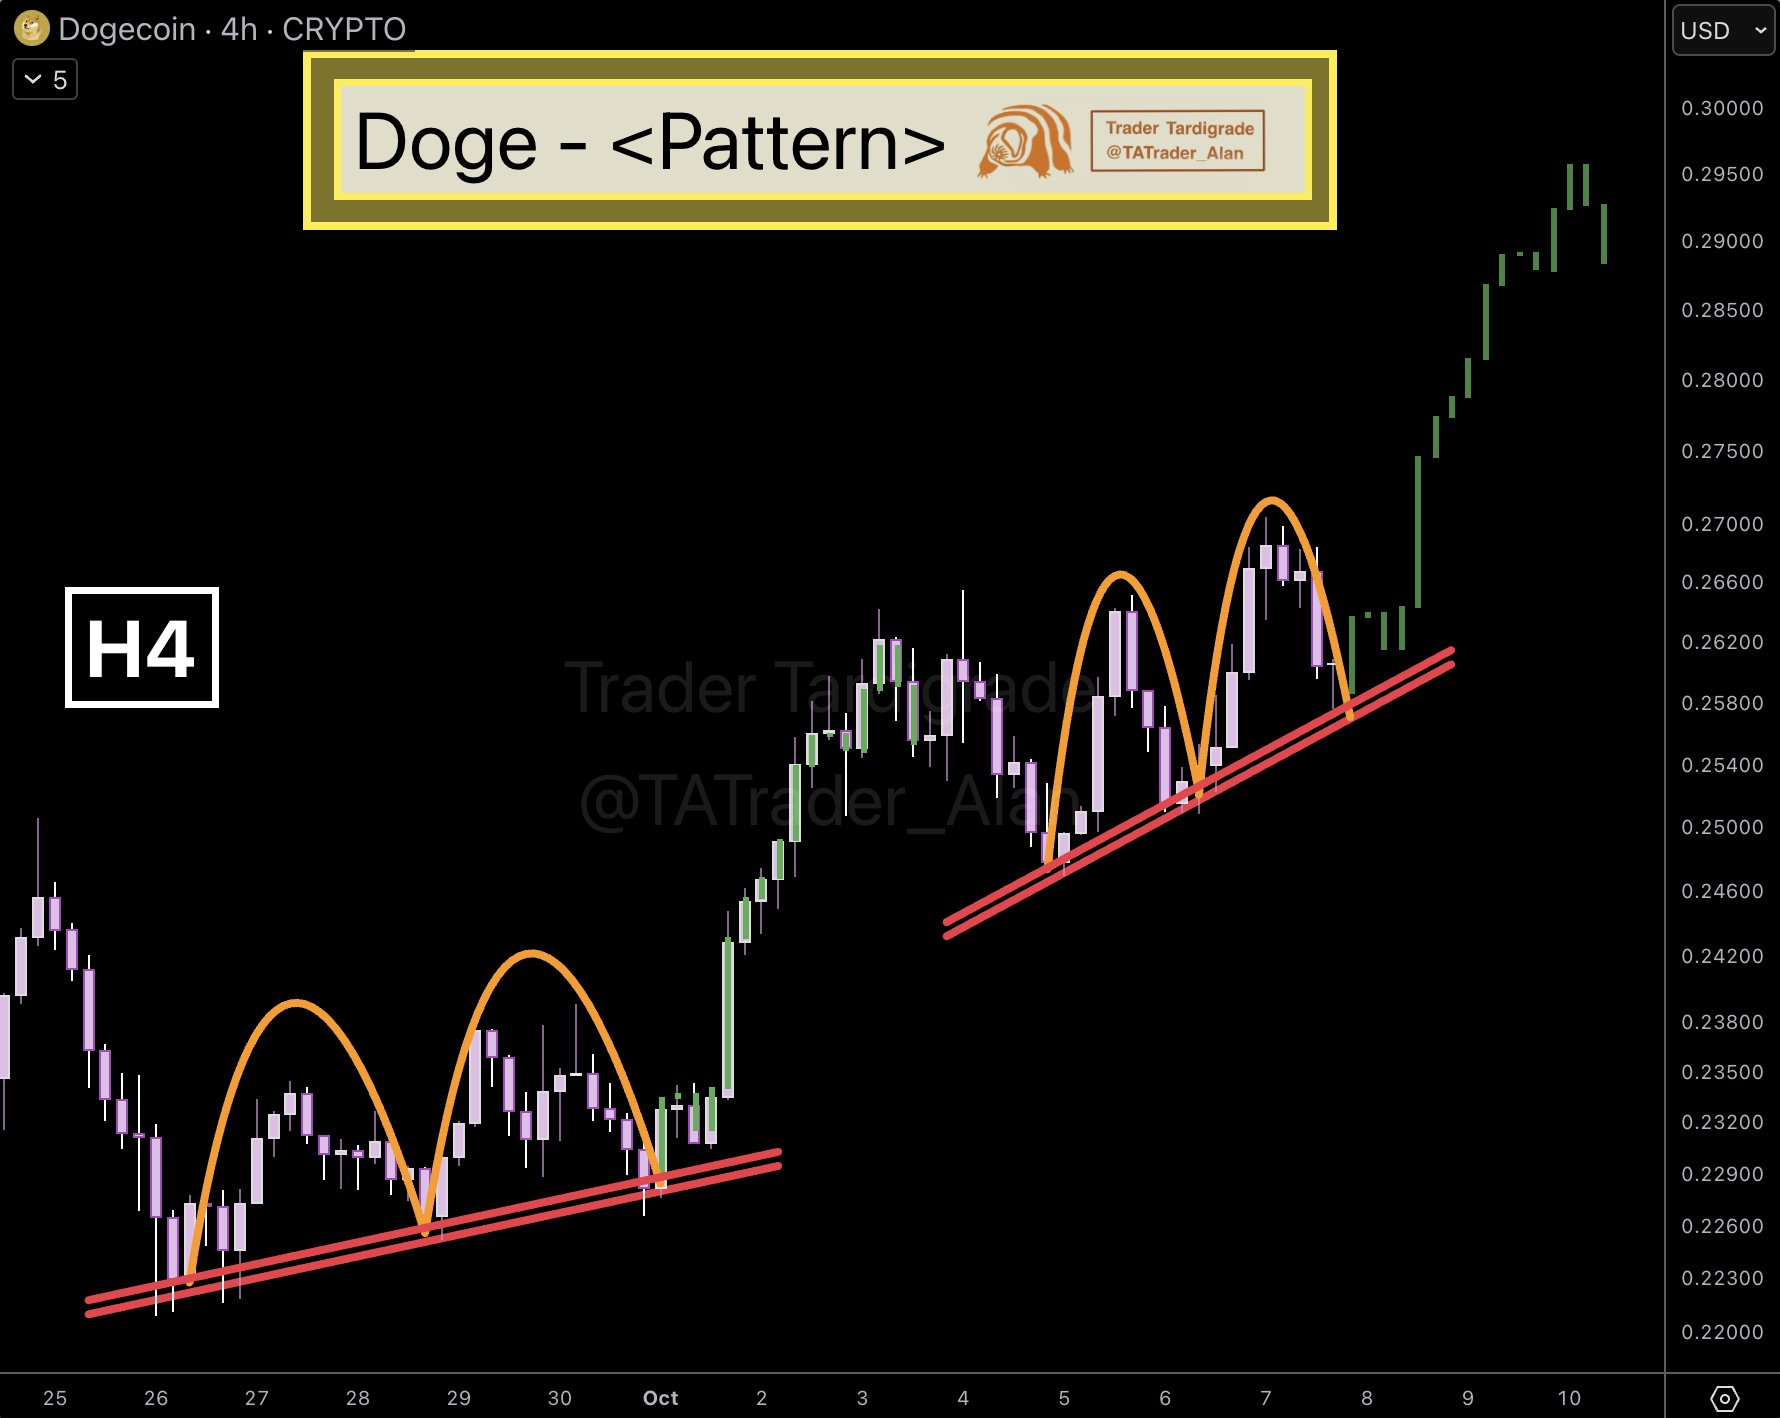

For context, the rising trendline particularly suggests that Dogecoin’s price is in a bullish phase, making higher lows and gradually rising over time.
This pattern started forming around October 4, after the price fell from $0.26. The bulls tried to push Dogecoin through that resistance, but were overpowered by the bears, and DOGE was back to the trendline support around $0.25. Another attempt happened on October 6, with bulls pushing above $0.27, but DOGE again retraced back to the trendline support.
A Recurrent Pattern?
However, this is not the first time this pattern has appeared. The chart shows a previous attempt that started materializing on September 26, when Dogecoin was trading at around $0.22. At the time, the first attempt to break resistance was cut off at $0.234, pulling Dogecoin back to the support trendline at $0.225 by September 28. A second attempt started outright and was also cut short on September 29, at just above $0.235.
Despite DOGE falling back to the support trendline, the fact that the price didn’t break below this trendline in both instances is an indicator of buying interest at these levels. Later, upon returning to the trendline support, the price surged from $0.22 on September 30 to reach $0.26 by October 3.
Based on this initial trajectory, the analyst believes Dogecoin has the potential to break out again. According to the latest forecast, the analyst believes Dogecoin could surge above $0.29. Notably, from the current price of $0.2454, Dogecoin would need to surge by 18.2% to reach $0.29.
Dogecoin Market Cap to $1 Trillion?
Notably, this is not the first bullish prediction for DOGE this week. For instance, on October 6, analyst Kaleo shared his outlook on Dogecoin, stating that a price of $6.90, which would give Dogecoin a $1 trillion market cap, remains a significant target. He pointed out that Dogecoin reached nearly $100 billion in the last cycle, while Bitcoin surpassed $1.2 trillion.
Kaleo compared their market caps, noting that Dogecoin’s was about 8.33% of Bitcoin’s in previous cycles. With Bitcoin potentially reaching a $12.5 trillion market cap this cycle, Kaleo believes a $1 trillion market cap for Dogecoin is feasible, especially with signs of a memecoin supercycle emerging.
DisClamier: This content is informational and should not be considered financial advice. The views expressed in this article may include the author’s personal opinions and do not reflect The Crypto Basic opinion. Readers are encouraged to do thorough research before making any investment decisions. The Crypto Basic is not responsible for any financial losses.