

Chainlink (LINK) remains confined to a narrow trading range as the market focuses on key technical levels. Analysts have noted that the cryptocurrency is consolidating after a long period of decline. The price movements indicate a balance between buyers and sellers.
On Saturday, March 7, Chainlink (LINK) is trading at $8.81, showing a decline of 4.24% in the past 24 hours. The trading volume stands at $680.17 million, down 14.41%. The token’s total market capitalization stands at $6.24 billion, according to CoinMarketCap data.
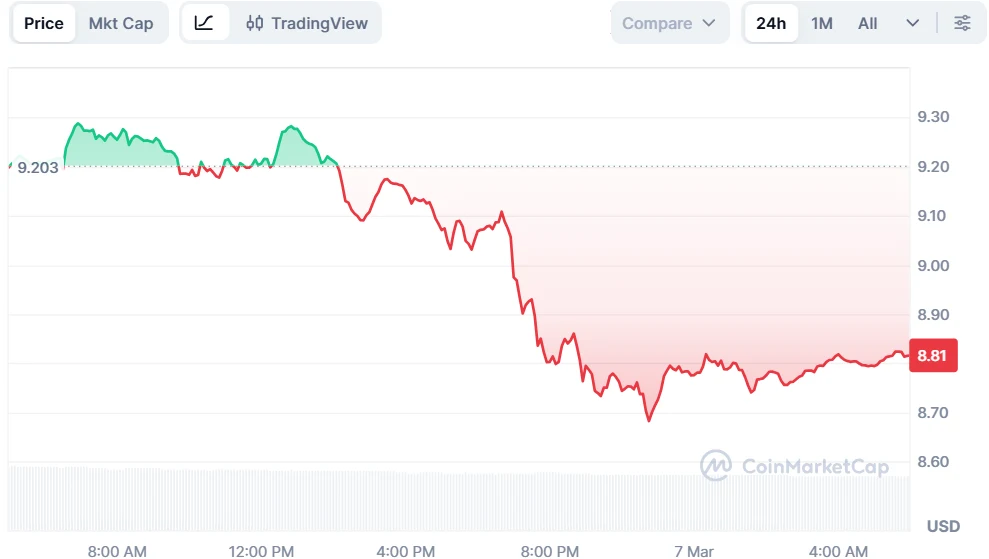
Source: CoinMarketCap
LINK Bulls Defend Key $7.95 Support
Analysts are assessing the recent price structure. Analyst MarkETH highlighted that LINK has broken out of its descending channel. However, the breakout did not trigger a strong continuation. Price action remains limited despite the structural change.
Currently, LINK’s price is trading within a specific range. The token is consolidating near the $9 price level. There is support at the $7.95 level, and resistance is present in the $9.60 region.
The price of LINK is constantly defended by its buyers at the $7.95 price level. There were also attempts to break through the resistance at the $9.60 price level, but these attempts were rejected, and the price went back to the middle of the range.
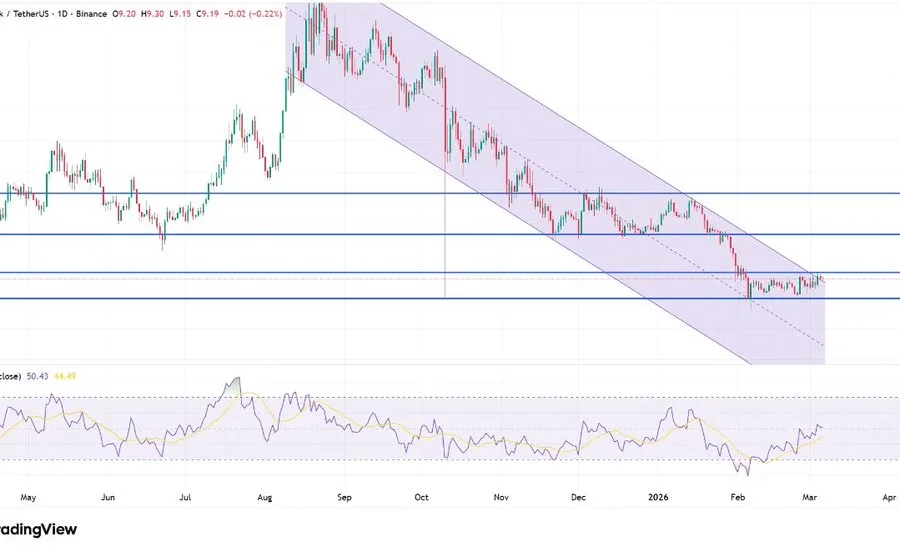
Source: X
A break above the level of $9.60 will definitely change the structure in the short term. This will likely shift the momentum towards the next level of resistance, which is at the level of $12. Until this happens, the price is expected to continue moving within the current boundaries.
Additionally, another analyst, Alpha Crypto Signal, mentioned a different technical structure on the four-hour chart. According to the analyst, the price of the token is currently trading within a well-established ascending channel. The price is currently respecting the upper and lower support lines.
Also Read: LINK ETFs Record 13 Weeks of Consecutive Inflows
Within this structure, the price is rotating between the levels within the channel. This pattern also indicates higher lows, which is a form of support. This is a sign that the price is gradually going up. The middle line in the channel is the balance area in the short term.
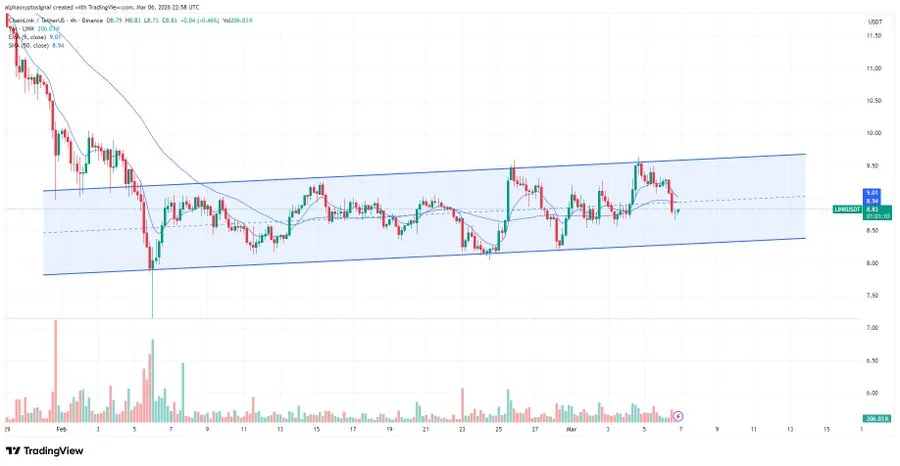
Source: X
As long as the price holds above the rising support line, the technical formation remains bullish. A test of the higher end of the line could be achieved if the buying pressure continues.
However, if the price goes below the lower end of the line, the bullish formation will be invalidated. This will change the momentum to the downside.
RSI and MACD Signal Stabilizing Momentum
The Relative Strength Index (RSI) current value is 45.90. The moving average for the RSI is 44.54. The values are below the midpoint value of 50. The reading signals neutral momentum without overbought or oversold pressure.
The Moving Average Convergence Divergence (MACD) indicator shows that the histogram is at 0.11. The MACD line is at -0.18, and the signal line is at -0.29. The histogram still shows a positive value despite both lines being bearish. This structure reflects weakening bearish pressure in the indicator.
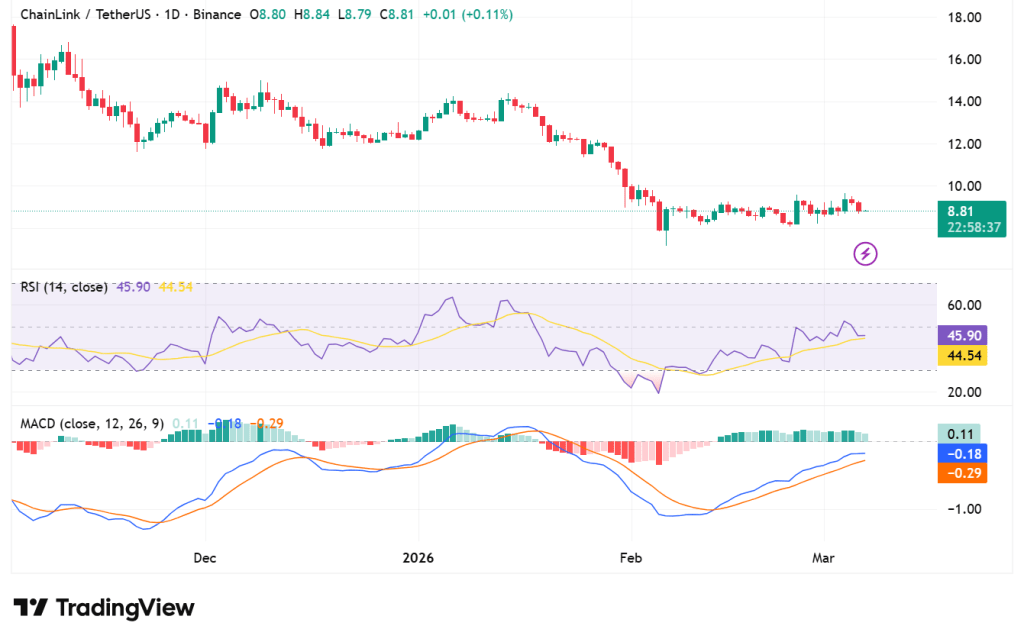
Source: TradingView
Also Read: Toncoin (TON) Eyes Powerful 29% Jump Despite Bearish Signals