
Compound’s “Renewing the Community Multisig” proposal is live and marked Active as of Oct. 12–13, 2025. The measure extends the one-year mandate approved in April and refreshes signers for the protocol’s security-critical wallet.
The text on Tally notes continuity with the prior framework while updating operational details. The proposal page shows the status and current voting window for delegates.
Comp.Vote also lists the item among recent proposals, confirming the active state and timing. This provides a second venue for delegates to track and sign votes.
tBTC collateral on Arbitrum advances to a vote
A proposal from WOOF! seeks to add tBTC as collateral in the Compound III USDT market on Arbitrum. The item is open on Tally with rationale and the execution steps needed to update the market configuration․
The push follows earlier tBTC risk discussions across Compound markets. Forum threads document parameter guidance and sequencing for tBTC across Comets.
Separately, Compound Governance’s X feed has highlighted tBTC-related votes and deadlines this month, indicating sustained delegate attention on Bitcoin-backed collateral.
Gauntlet recommends 50% supply-cap cuts on low-use markets
Gauntlet published new recommendations on Oct. 10, urging 50% supply-cap reductions where utilization sat well below 5% over the last 30 days. The aim is to trim idle risk without disrupting existing positions.
An earlier September post proposed similar reductions across mainnet WETH and wstETH Comets, setting the stage for this week’s follow-on set. The thread outlines markets, methodology, and monitoring plans.
Recent on-chain items also reflecttargeted cap and incentive changes tied to these reviews, keeping risk settings aligned with usage.
V2 deprecation enters the execution window
Gauntlet’s V2 deprecation plan set a late-September to October timeline: forum post on Sept. 19, Snapshot by Sept. 29, UI banner from Oct. 6, and on-chain actions in mid-October to pause new supply and borrows while leaving repayments and withdrawals open.
Messari’s governance tracker summarizes the same path and intent: shift activity to Compound III’s isolated-collateral architecture and reduce V2’s systemic surface area.
Compound’s governance docs detail the standard proposal cadence and delays, which frame when any queued V2 actions can be executed once votes conclude.
COMP price consolidates below key resistance before projected rebound
Compound’s COMP/USDT perpetual contract on Binance shows price consolidating just under the $41 zone after a sharp pullback. The three-hour TradingView chart from Oct. 10 captures a clean rejection at mid-range resistance, followed by a sweep of the lower boundary around $40.42–$40.68. The move flushed short-term longs and returned price to a previously defended support band, highlighted in red. The quick wick through support indicates aggressive stop-hunting rather than sustained selling.
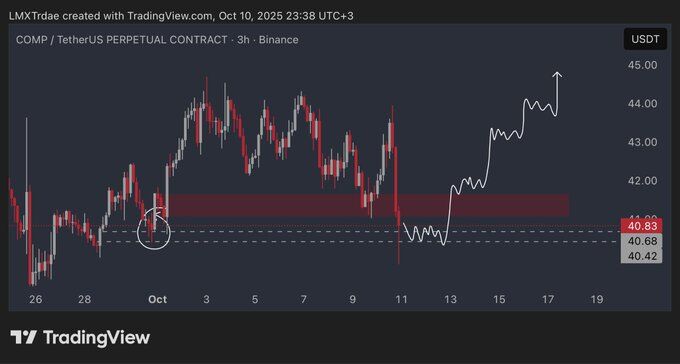
After the drop, the outlook highlights a stabilization phase just above the key horizontal zone. The projected path shows accumulation between Oct. 11 and Oct. 13 before a breakout toward $42. The chart suggests that reclaiming the red resistance block would mark a structural shift, signaling renewed upward momentum. Price behavior around this zone will define the next leg.
The projection traces a breakout extension toward $45 by Oct. 17. The white path illustrates a clean retest of broken resistance before continuation. This aligns with the previous reaction zone circled on the left side of the chart, where price reversed after a similar sweep. If price follows the mapped structure, the breakout could confirm a short-term bullish reversal above key resistance levels.
COMP collapses, rebounds sharply, and consolidates below 50-EMA
Compound’s COMP/USD pair on Coinbase printed a violent four-hour candle on Oct. 11. Price plunged from the $39 zone to just above $21 in minutes, triggering heavy liquidations. The collapse erased more than 40% of value before aggressive buyers stepped in. The rebound lifted COMP back to the $35 area within the same session, highlighting how thin liquidity amplified the initial drop. Volume spiked sharply during the crash and recovery, underscoring the scale of forced liquidations and opportunistic entries.
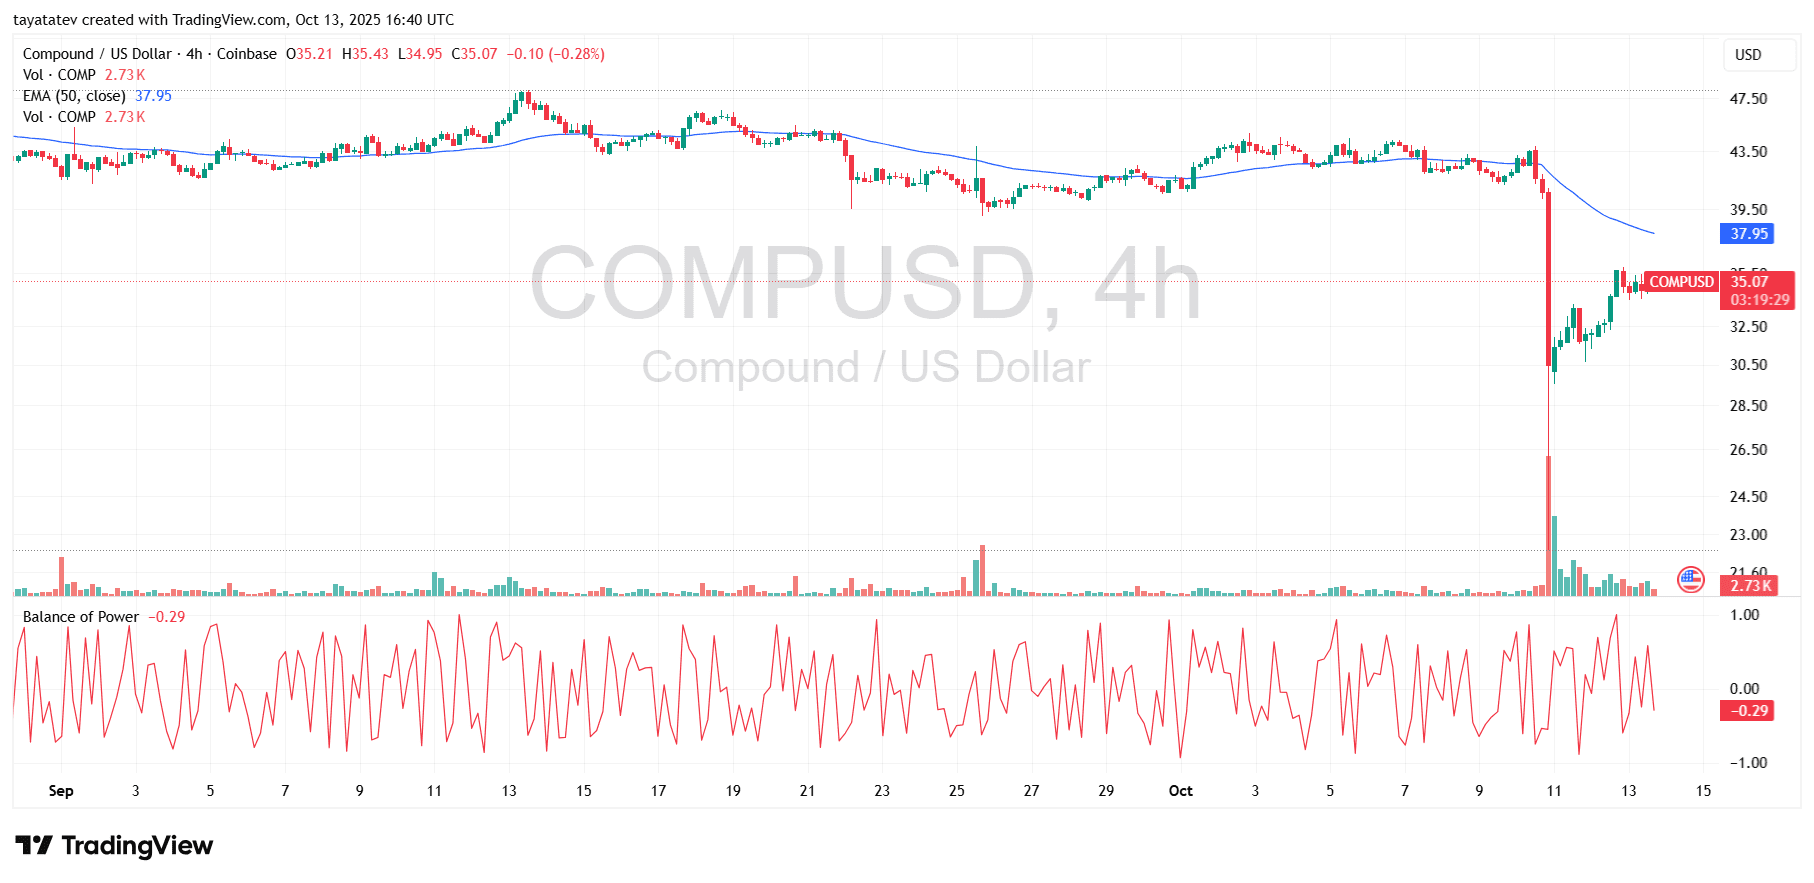
After the spike, COMP began consolidating between $34.50 and $35.50. Price now sits below the 50-period Exponential Moving Average (EMA) at $37.95. The EMA turned downward after weeks of flattening, showing a clear shift in trend strength. COMP must reclaim and hold above this EMA to confirm any sustained bullish reversal. Until that happens, the structure favors continued consolidation or a retest of lower levels.
The Balance of Power (BoP) indicator reads −0.29, showing sellers still have control despite the bounce. However, the magnitude of the recovery candle and follow-through suggests strong dip absorption. If price maintains support above $33 and challenges the EMA zone, momentum could flip toward the upside. Conversely, failure to break through the $38 resistance band would keep COMP capped, exposing the $30–$32 zone again. Traders are now watching whether the post-crash recovery evolves into a stable accumulation phase or stalls beneath the trend line.
RSI shows momentum reset, not a confirmed uptrend
The 14-period RSI on COMP crashed below 20 during the Oct. 11 selloff, then reclaimed the 30 line and now prints near 45. This sequence signals an oversold washout followed by fast mean reversion. The rebound also pushed the RSI above its smoothing line, which has curled higher, indicating short-term momentum has turned up.
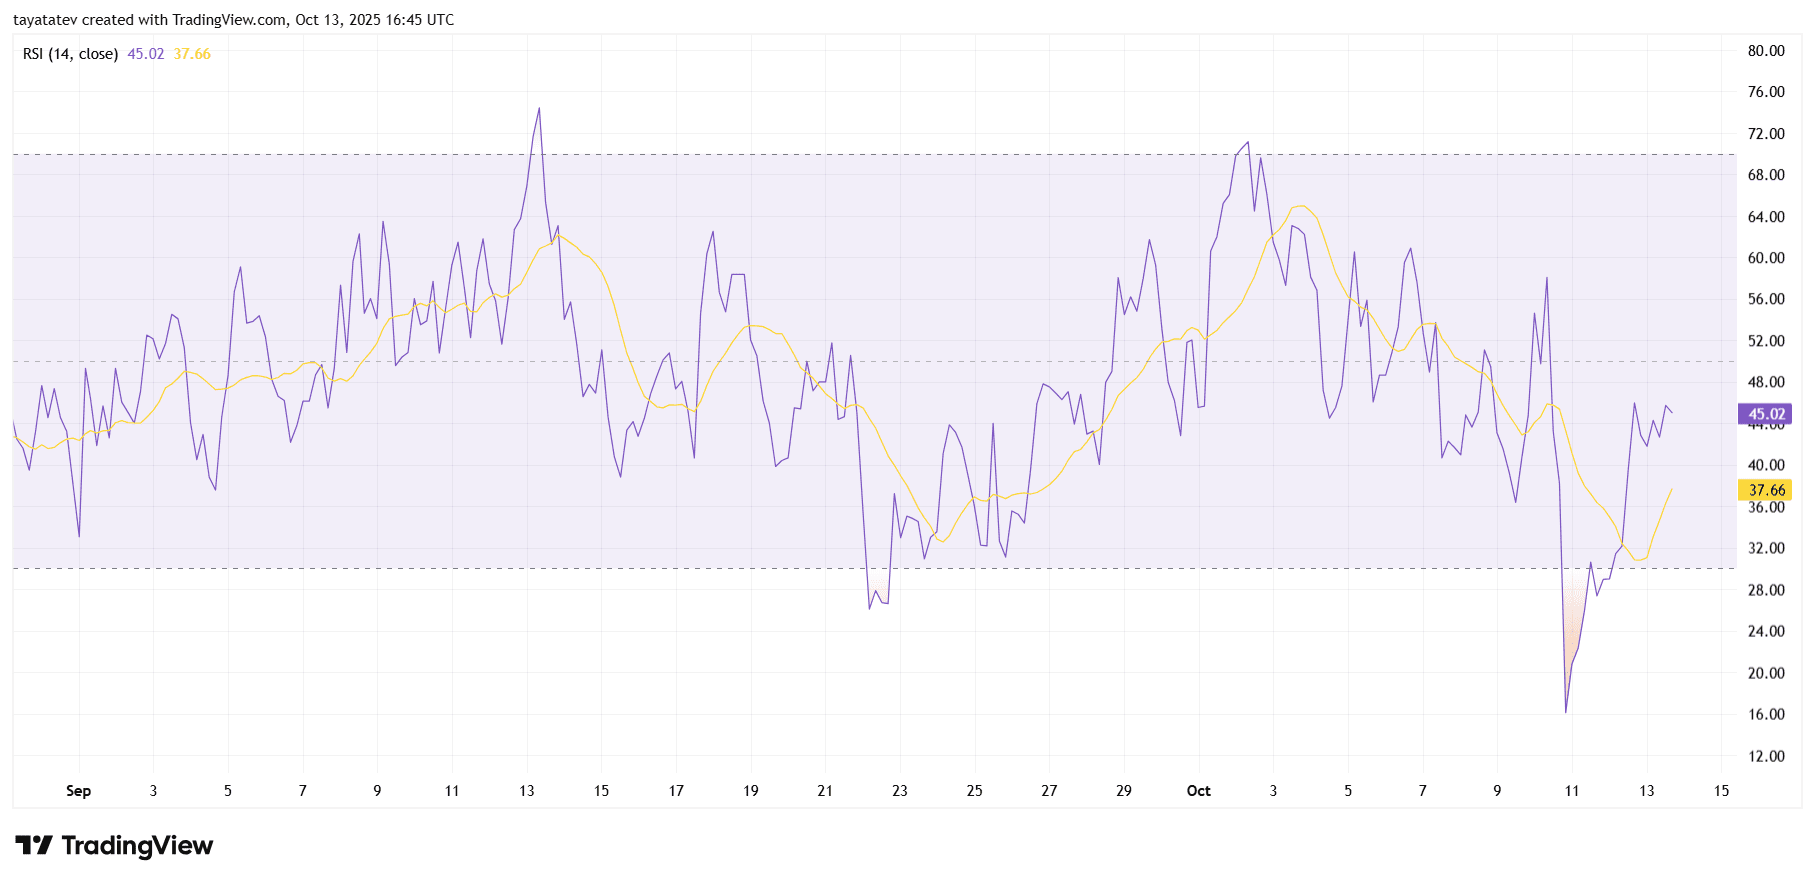
However, the oscillator still sits below the neutral 50 area. Until RSI holds above 50–55, the move reads as recovery rather than a new trend. If RSI builds a base around 40–45 and the average continues rising, buyers can press a test of overhead levels on price. Sustained closes with RSI north of 50 would strengthen that case.
Alternatively, a rollover of RSI back under 40 would warn that the bounce is fading. In that path, sellers could force a retest of the post-flush support band on price. Therefore, watch for continued RSI higher lows and a clean hold above its moving average to confirm follow-through.