Welcome to our institutional newsletter, Crypto Long & Short. This week:
- Leo Mindyuk on how executable liquidity at scale is more fragmented and fragile than most institutions assume
- Top headlines institutions should pay attention to by Francisco Rodrigues
- Helium’s deflationary flip in Chart of the Week
Expert Insights
Crypto’s liquidity mirage: why headline volume doesn’t equal tradable depth
– By Leo Mindyuk, co-founder and CEO, ML Tech
Crypto looks liquid, until you try to trade large volumes. Especially during periods of market stress and even more so if you want to execute on coins outside of the top 10-20.
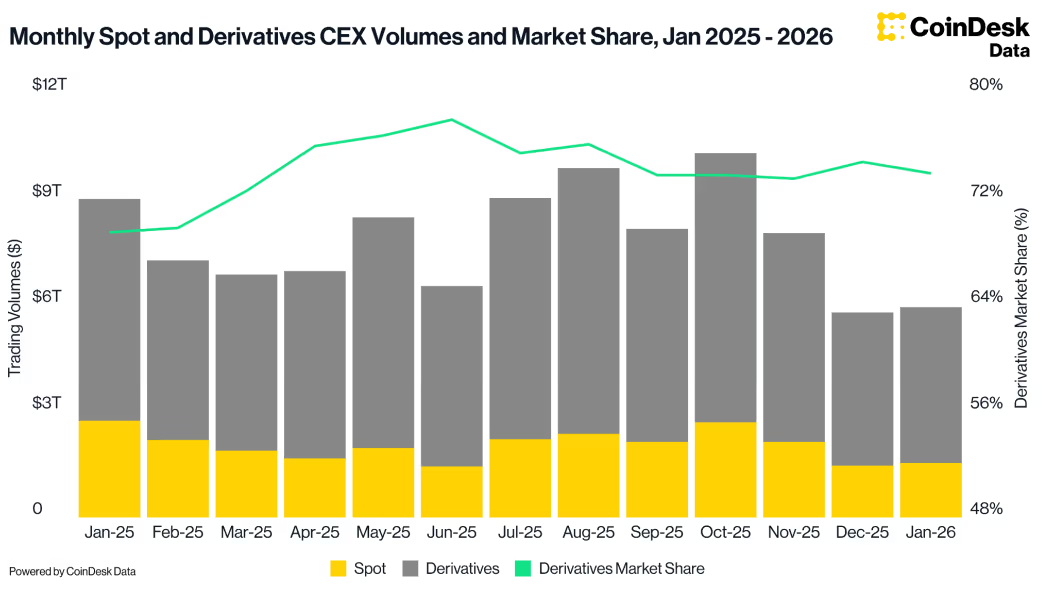
On paper, the numbers are impressive. Billions traded in daily volume and trillions traded in monthly volume. Tight spreads on bitcoin and ether (ETH). Dozens of exchanges competing for flow. It resembles a mature, highly efficient market. The beginning of the year saw around $9 trillion of monthly spot and derivatives volumes, then October 2025 saw around $10 trillion in monthly volume (including a lot of activity around the October 10th market bloodbath). Then in November, derivatives trading volumes decreased 26% to $5.61 trillion, recording the lowest monthly activity since June, followed by even larger declines in December and January, according to CoinDesk Data. Those are still some very impressive numbers, but let’s zoom in further.

At first glance there are a lot of crypto exchanges competing for flow, but in reality just a small group of exchanges dominate (see the graph below). If those have liquidity thinning out or connectivity issues preventing the execution of volume, the whole crypto market is impacted.

It’s not just that the volumes are concentrated on a few exchanges, they are also highly concentrated in BTC, ETH and a couple of other top coins.
The liquidity seems quite solid with a number of institutional market makers active in the space. However, the visible liquidity is not the same as executable liquidity. According to Amberdata (see the graph below), markets that showed $103.64 million in visible liquidity suddenly had just $0.17 million available, a 98%+ collapse. The bid-ask imbalance flipped from +0.0566 (bid-heavy, buyers waiting) to -0.2196 (ask-heavy, sellers overwhelming the market at a 78:22 ratio).

For institutions deploying meaningful capital, the distinction becomes obvious very quickly. The top of the book might show tight spreads and reasonable depth. Go a few levels down, and liquidity thins out fast. Market impact doesn’t increase gradually, it accelerates. What looks like a manageable order can move price far more than expected once it interacts with real depth.

The structural reason is simple. Crypto liquidity is fragmented. There is no single consolidated market. Depth is distributed across venues, each with different participants, latency profiles, API systems (that can break or have disruptions) and risk models (that can come under stress). Reported volume aggregates activity, but it does not aggregate liquidity in a way that makes it easily accessible for large execution. This is specifically apparent for smaller coins.
That fragmentation creates a false sense of comfort. In calm markets, spreads compress and books look stable. During volatility, liquidity providers reprice or pull entirely. They get unfavorable inventory and are unable to de-risk and pull out their quotes. Depth disappears faster than most models assume. The difference between quoted liquidity and durable liquidity becomes clear when conditions change.
What matters is not how the book looks at 10:00 a.m. on a quiet day. What matters is how it behaves during stress. Experienced quants know that but most of the market participants do not, as they struggle to close open positions gradually and then get liquidated during the stress events. We saw this in October, and a couple of times since.
In execution analysis, slippage does not scale linearly with order size; it compounds. Once an order crosses a certain depth threshold, impact increases disproportionately. In volatile conditions, that threshold shrinks. Suddenly, even modest trades can move prices more than historical norms would suggest.
For institutional allocators, this is not a technical nuance. It is a risk management issue. Liquidity risk is not only about entering a position, it is about exiting when liquidity is scarce and correlations rise. Want to execute a couple of millions of some smaller coins? Good luck! Want to exit losing positions in less liquid coins when the market is busy like during the October crash? It can become catastrophic!
As digital asset markets continue to mature, the conversation needs to move beyond headline volume metrics and top level liquidity snapshots during the calm markets. The real measure of market quality is resilience and how consistently liquidity holds up under pressure.
In crypto, liquidity isn’t defined by what’s visible during normal stable conditions. It’s defined by what’s left when the market gets tested. That’s when capacity assumptions break and risk management takes center stage.
Headlines of the Week
Wall Street giants have kept moving deeper into the cryptocurrency space over the past week, while new data has shed light on just how large the space is in Russia and how big it could become in Asia. Major market participants Binance and Strategy have meanwhile doubled down on their massive BTC reserves.
- Wall Street giants enter DeFi market with token investments: BlackRock has made its tokenized U.S. Treasury fund BUIDL tradable on decentralized exchange Uniswap, as part of a deal that saw it invest an undisclosed amount in UNI. Similarly, Apollo Global Management (APO) struck a cooperation agreement with Morpho.
- Russia’s daily crypto turnover exceeds $650 million, the Ministry of Finance says: The country’s government and central bank are pushing for legislation to regulate cryptocurrency activities, while the Moscow Exchange is looking to deepen its presence in the market.
- Binance converts its $1 billion safety net into 15,000 BTC: Leading cryptocurrency exchange Binance has finished converting the Secure Asset Fund for Users (SAFU) into bitcoin, turning about $1 billion into 15,000 BTC.
- BlackRock exec says 1% crypto allocation in Asia could unlock $2 trillion in new flows: BlackRock’s head of APAC iShares, Nicholas Peach, has said that even a modest portfolio allocation to crypto in Asia could unlock $2 trillion in new flows.
- Strategy says it can survive even if bitcoin drops to $8,000 and will ‘equitize’ debt: Strategy, the largest bitcoin treasury firm with 714,644 bitcoin on its balance sheet, said it can withstand a bitcoin price drop to $8,000 and still cover its roughly $6 billion in debt.
Chart of the Week
Helium’s deflationary flip
Helium has surged 37.5% month-to-date, decoupling from the broader market as its fundamentals shift toward a deflationary model. Since the start of 2026, the protocol’s net emissions have turned negative, effectively neutralizing long-standing sell pressure. This transition is fueled by a jump in network demand, with daily Data Credit burns climbing from $30,000 to over $50,000 since the beginning of the year, signaling that utility-driven token destruction is now outpacing new issuance.

Listen. Read. Watch. Engage.
Looking for more? Receive the latest crypto news from coindesk.com and explore our robust Data & Indices offerings by visiting coindesk.com/institutions.
Note: The views expressed in this column are those of the author and do not necessarily reflect those of CoinDesk, Inc., CoinDesk Indices or its owners and affiliates.