
Dogecoin’s ecosystem highlighted a new “Cardinals Index Node” today, presented as software that speeds on-chain data indexing and lowers the barrier to running a node. Coverage describes faster ledger queries and simpler setup for community operators. However, it is framed as a community-led release rather than an official Dogecoin Core build.
Moreover, the latest tagged Dogecoin Core release on GitHub remains version 1.14.8, published in late 2024, which signals no new Core version landed alongside today’s indexing tool. This detail helps separate third-party tooling from the main client. It also clarifies expectations around protocol-level changes versus ecosystem utilities.
Consequently, developers and node runners can test the indexing node while keeping production Core clients stable. The distinction matters for reliability and security. It also shows how community software can expand functionality without altering consensus code.
Bitwise filed Amendment No. 3 to its Dogecoin ETF registration on October 6, indicating active engagement with the Securities and Exchange Commission. The amended S-1 outlines operational details and keeps the product in the queue under the new, faster listing environment. The filing date anchors today’s regulatory timeline.
Separately, Nasdaq asked to list the 21Shares Dogecoin ETF earlier this year, with the proposal published in the Federal Register. That proceeding remains a key reference for venue-level approvals. Together, these items show parallel sponsor and exchange steps.
In addition, the SEC’s September 18 rule change created generic listing standards for spot crypto ETFs, shortening potential timelines. As a result, DOGE products now move through a clearer pathway than before. This context explains why amended filings and venue proposals continue to surface.
A corporate update today said CleanCore Solutions now holds more than 710 million DOGE as part of a treasury program targeting one billion DOGE. The notice emphasized unrealized gains and the ability to continue acquisitions with existing cash. It also cited exchange partnerships supporting execution.
Furthermore, the accumulation appears framed as a balance-sheet strategy instead of a short-term trade. This approach keeps the development non-price and operational. It also positions DOGE within standard corporate disclosures.
Taken together, the node rollout, the ETF filing activity, and the treasury update outline Dogecoin’s non-price landscape today. The items span infrastructure, regulation, and corporate adoption. They also show how DOGE news now extends beyond market moves.
CleanCore adds 710 million Dogecoin to treasury
CleanCore Solutions said it now holds over 710 million Dogecoin on its balance sheet. The company reiterated a target of one billion DOGE and cited enough cash to keep buying. It also noted execution support through Bitstamp by Robinhood.
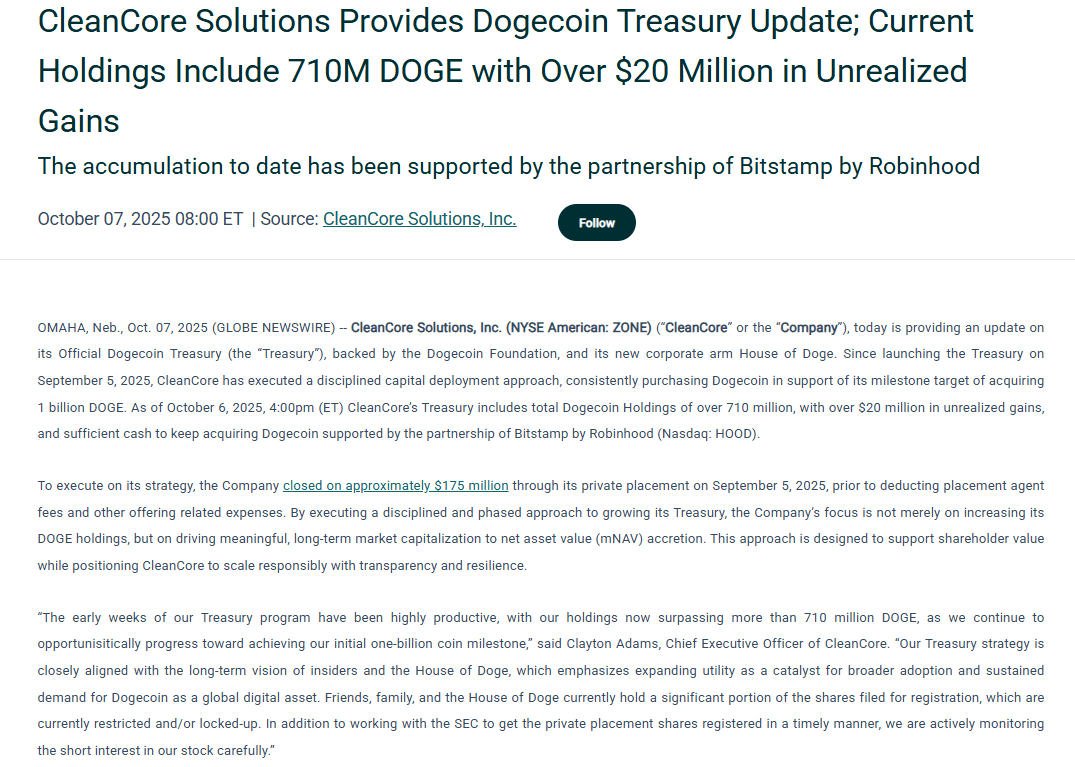
The firm valued the holdings near $174 million using prevailing market data. It disclosed more than $20 million in unrealized gains tied to the position. It previously raised about $175 million before expenses via a Sept. 5 private placement.
The update came with routine stock details. CleanCore closed Tuesday at $2.06, down 8.44%, and ticked to $2.09 after hours. The company kept the focus on treasury strategy rather than short-term moves.
CleanCore said it aims to scale its treasury “responsibly with transparency and resilience.” The company framed the plan as long term and tied to shareholder value. It linked the approach to building utility around the asset base.
Executives referenced the market cap relative to net asset value metric, or mNAV. They said the goal is to improve mNAV as treasury assets expand. They also stressed steady execution and clear disclosure.
Chief Executive Clayton Adams connected the strategy to insider alignment and the House of Doge. He said the vision places utility at the center of broader adoption. He positioned Dogecoin as a global digital asset within that plan.
However, some analysts downplay mNAV as a primary yardstick for crypto treasuries. NYDIG’s Greg Cipolaro argued the metric can miss key factors. He pointed to operating businesses and convertible debt as examples.
Therefore, critics warn that a single ratio can distort performance views. They prefer a fuller read of cash flows, liabilities, and execution. They also track treasury cost basis and liquidity conditions.
Standard Chartered added a caution for smaller firms in this segment. It warned of overexposure risks as more treasuries form. If mNAVs remain depressed, it expects consolidation led by stronger players.
Recent market structure changes formed part of the backdrop. The first U.S. Dogecoin exchange-traded fund launched in mid-September. It recorded about $6 million in first-day trading volume.
Moreover, sponsor interest has continued across venues and filings. These steps expand non-price adoption channels for DOGE exposure. They also add new reporting streams around custody and creation activity.
Separately, CEA Industries reported holding 480,000 BNB. It disclosed an average purchase price of $860 per token. The filing placed the investment cost near $412.8 million and a mark near $585.5 million.
The DOGE/USD chart compares two recent Dogecoin structures on the daily timeframe. First, it highlights a sequence of lower highs against steady support, forming a compact descending triangle. Then, it shows a clean breakout that accelerates vertically. The second box mirrors the first: price compresses again inside a similar triangle, then expands with strong, consecutive candles. Consequently, the visual suggests momentum tends to build after periods of tight range and declining volatility.
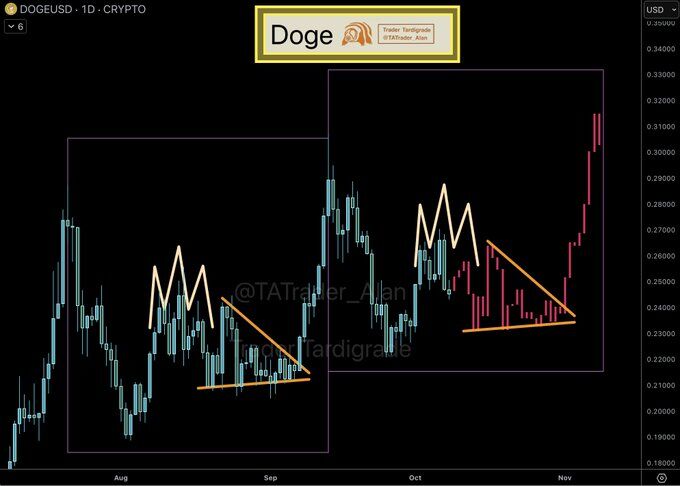
Moreover, you can see how each compression phase resets the trend without breaking the broader advance. During both setups, candles cluster near the triangle apex, which usually precedes expansion. As the breakout begins, bodies extend and wicks shorten, indicating conviction and follow-through. In practical chart terms, that transition reflects a shift from balance to imbalance, with bids overwhelming the resting supply along the down-sloping trendline.
Finally, structure matters for continuity. In both boxes, once price closes above the triangle’s upper boundary, it avoids immediate reversal and instead stair-steps higher. That behavior confirms acceptance above the breakout zone and often turns the former trendline into support on shallow pullbacks. Therefore, the repeating sequence—compression, break, and acceptance—anchors the current leg, while any decisive daily close back inside the triangle would mark the first warning that the pattern has failed.
The chart maps a persistent supply zone from roughly $0.25 to $0.28 that has capped advances since spring. Price repeatedly tagged the rising blue trendline and failed near the same horizontal area, which establishes a well-defined ceiling. Meanwhile, buyers continue to defend higher lows above the mid-$0.20s, so structure tightens between ascending support and static resistance.
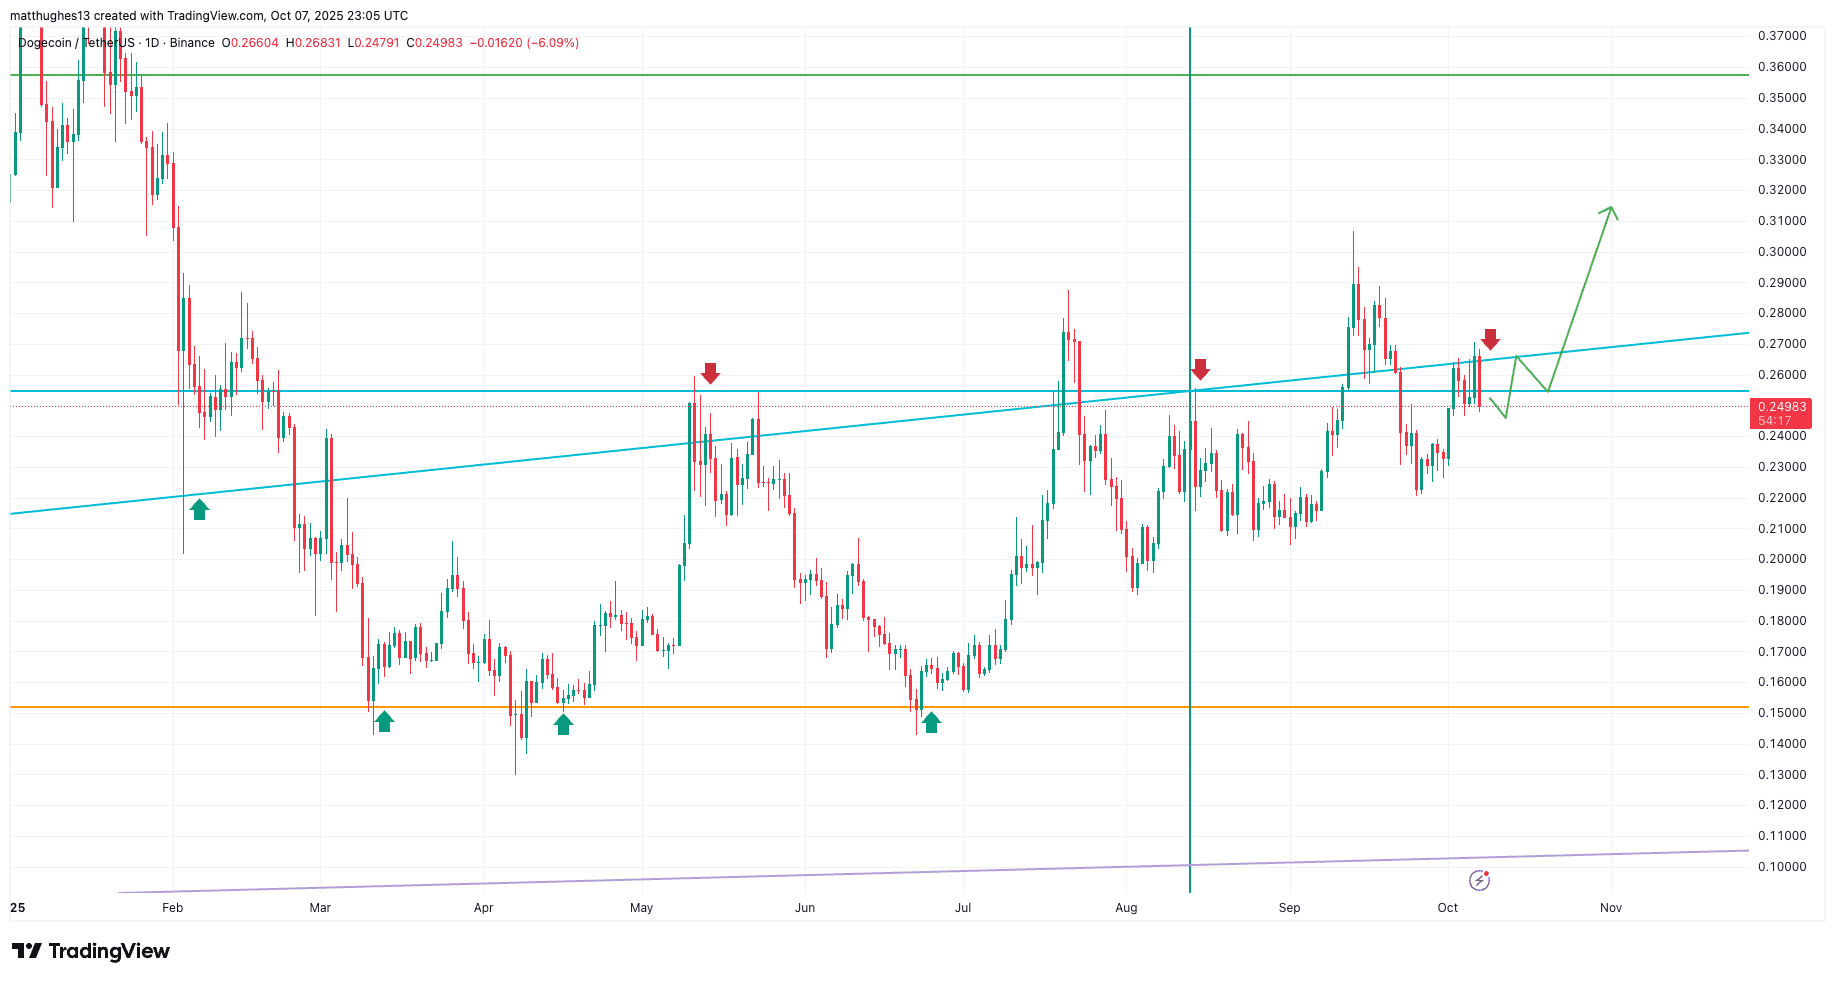
Moreover, the green path sketches a typical breakout sequence: brief consolidation around ~$0.24 to reset momentum, a reclaim of ~$0.27 with strong bodies, and then acceptance above the blue line. If that acceptance holds, the next historical shelf appears near ~$0.36, which aligns with the top reference drawn on the chart. In practice, a clean daily close through the band, followed by a shallow retest that holds, would confirm control shifting to buyers.
However, risk sits just below the band. If candles slip back under ~$0.24 after testing ~$0.27, it would show supply remains active and the range persists. Therefore, watch for expanding ranges and shorter upper wicks on attempts through the zone, plus rising participation. Those behaviors typically differentiate a true break from another fade at resistance.
Dogecoin’s 14-day RSI sits around 49, with its signal line near 50. Momentum remains balanced, since the oscillator holds close to the 50 midline and avoids extremes. Recently, RSI slipped just below its signal, which shows a slight loss of short-term drive after September’s stronger readings.
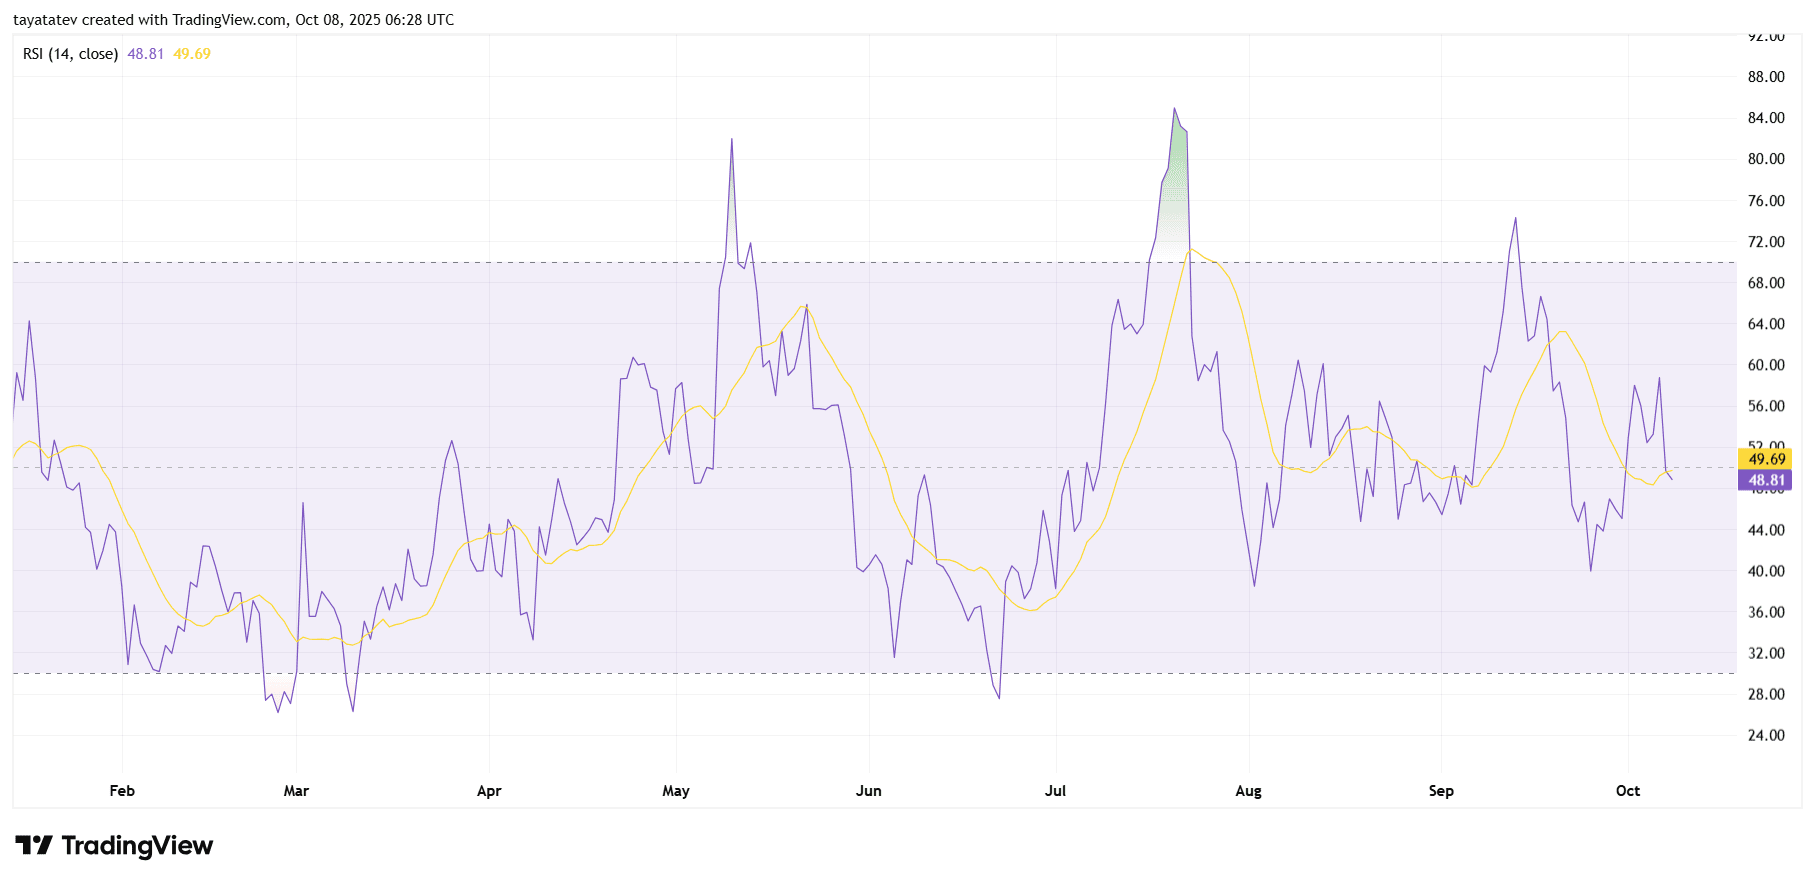
However, structure still looks constructive because RSI has spent more time above 40 than below 30 since August. Each dip toward the low-40s found support, and then RSI rebounded toward the mid-50s. That rhythm reflects a market rotating rather than trending, while buyers and sellers trade control around the midpoint.
Looking ahead, momentum confirmation needs follow-through. A decisive push and hold above 55–60 would signal strengthening trend energy and usually accompanies clean breakouts on price charts. Conversely, a drop under 40—especially with the signal curling lower—would indicate fading demand and a likely return to range behavior.