
U.S. and U.K. authorities advanced parallel actions tied to alleged forced-labor “pig-butchering” scams, while the U.K. also outlined a path to reimburse victims of a separate 2018 bitcoin fraud. Meanwhile, Bitcoin Core shipped a major release, Square publicly demoed Lightning payments at a U.S. coffee chain, miners leaned further into AI/HPC services, and U.S. listing rules paved a faster path for new spot-crypto ETFs.
DOJ files record bitcoin forfeiture; Cambodia responds
The U.S. Department of Justice unsealed an indictment against Prince Group chair Chen Zhi and, in the same matter, filed what it called the largest bitcoin forfeiture action in U.S. history—about $15 billion now in U.S. custody. The filing describes networks that allegedly exploited trafficked labor to run investment-fraud operations at scale.
In parallel, Cambodia said it would cooperate with international requests if supported by concrete evidence. Officials emphasized the presumption of legality for Chen’s citizenship and his companies, while acknowledging the seriousness of the allegations. The government statement arrived as global scrutiny intensified.
Together, the indictment and the Cambodian response frame a cross-border enforcement push focused on the infrastructure behind online scam compounds, not trading activity. Authorities and researchers warned that without sustained action against logistics and finance rails, similar operations could persist.
UK outlines compensation route for a separate 2018 Bitcoin fraud
Separately, the U.K. moved toward compensating victims of a 2018 investment fraud in which police discovered tens of thousands of bitcoin at a London home. Prosecutors tied the case to Zhimin Qian (Yadi Zhang) and an associate, both of whom admitted money-laundering offenses connected to investor funds converted into BTC.
The Director of Public Prosecutions signaled a scheme to reimburse victims, though specifics and eligibility remain subject to High Court proceedings. Legal teams for investors welcomed the step but pressed for broad coverage beyond those already in the litigation pipeline.
Officials also flagged additional recovered crypto assets while cautioning that proceeds remain bound by court process. Policymakers debated fiscal uses in theory, yet agencies underscored that any distribution must follow judicial outcomes.
Bitcoin Core 30.0 goes live with privacy and policy changes
Bitcoin Core version 30.0 became available this week. Maintainers highlighted new features, fixes, and performance improvements, and pointed users to the release notes for upgrade details. The project also reiterated its established channels for bug reports and security updates.
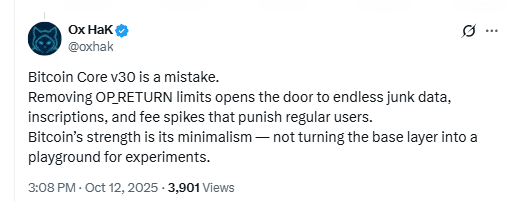
Industry coverage focused on optional encrypted peer-to-peer connections for improved privacy and on policy adjustments around data-carrying outputs, which sparked debate among developers and node operators. The client team published the canonical documentation to anchor that discussion.
As usual, the reference implementation’s release signals to downstream projects and services to evaluate compatibility. Operators typically stage upgrades after internal testing, especially when policy or networking behavior changes.
Square demos Lightning payments at Compass Coffee during DC Fintech Week
Square publicly showcased Lightning-powered bitcoin payments at Compass Coffee in Washington, DC, as part of a live demo tied to DC Fintech Week. Organizers positioned it as a consumer flow test rather than a commercial rollout.

Observers reported successful point-of-sale transactions on Square terminals, underscoring ongoing work to bring Lightning into mainstream retail contexts. The coffee chain, which operates dozens of locations in the capital, offered a visible venue to demonstrate the payment loop.
The pilot illustrates how payment processors can integrate Lightning while preserving familiar checkout steps. Next, stakeholders will likely assess settlement handling, refunds, and support flows before any broader availability.
Miners push deeper into AI/HPC as difficulty pressure stays high
Large mining companies continued expanding into high-performance computing and AI cloud services, citing stronger margins relative to pure bitcoin mining. Firms detailed data-center conversions, GPU fleet deployments, and multi-hundred-megawatt build-outs aimed at enterprise AI workloads.
At the same time, recent network data show difficulty and hashrate near historic highs this month, a combination that compresses mining economics for older hardware. Public miners therefore emphasized diversified revenue mixes while maintaining hashrate growth targets.
Analysts framed the strategy as a hedge against hashprice volatility: reuse power contracts and infrastructure for AI jobs while keeping optionality for future bitcoin-native expansions. Market commentary suggests the pivot will persist into 2026 as build cycles mature.
SEC streamlines path for additional spot-crypto ETFs beyond BTC/ETH
Finally, the U.S. Securities and Exchange Commission approved generic listing standards in September that shorten timelines for spot-commodity ETFs, including those tied to digital assets. The change allows major exchanges to list qualifying products under standardized rules rather than case-by-case approvals.
Industry participants expect the framework to enable a broader lineup of spot-crypto ETFs in coming months, subject to S-1 effectiveness and issuer readiness. Commissioners also reiterated differences between 40-Act and other structures that affect custody and governance.
For bitcoin-adjacent providers, the shift primarily affects market structure, distribution, and custody rails rather than day-to-day trading. However, it could widen access channels that sit alongside existing BTC products.
Bitcoin chart shows possible bearish divergence on weekly timeframe
The weekly Bitcoin chart highlights a potential bearish divergence between price action and the Relative Strength Index (RSI). The price made a new high in 2025, but the RSI continued to trend lower, forming a descending line that contrasts with the price’s curved top structure. This divergence often signals weakening momentum behind an extended rally.
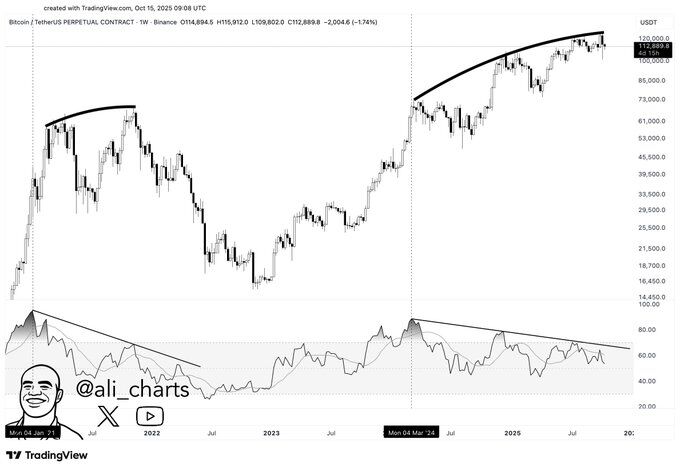
The chart uses Binance’s BTC/USDT perpetual contract and marks two distinct topping structures: one in late 2021 and another forming through 2025. In both cases, price pushed higher while RSI showed reduced strength. That setup previously preceded a major downturn, making the current pattern significant for market participants tracking technical signals.
The analyst, Ali (@ali_charts), presented the chart with a rhetorical question, emphasizing the contrast between optimistic $250,000 price projections and the weakening underlying momentum. The image suggests traders are debating whether this structure resembles the 2021 top or could diverge from historical behavior. The RSI slope and price curvature remain the focal points of this technical view.
Analyst rebuts bearish read, cites extended cycle and stronger RSI
Caiden (@Caiden_Legit) countered the bearish-divergence view, arguing the “third peak” in RSI this cycle aligns with a higher high in price, not a weakening top. He contrasted this with the prior cycle, where the third RSI peak preceded a lower high, and said today’s structure therefore differs in kind, not just degree.
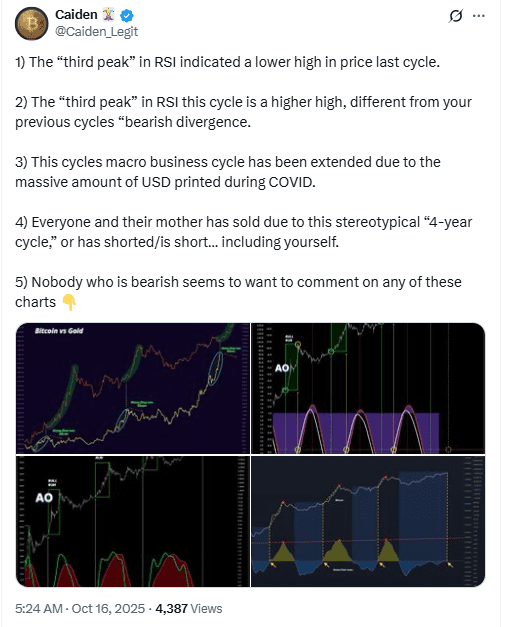
He added that macro conditions likely stretched the business cycle after COVID, pointing to unprecedented U.S. money creation as a driver. Consequently, he said historical four-year templates may mislead traders who expect the same timing and magnitude as past cycles.
Finally, Caiden claimed many participants sold or shorted based on that stereotype, while critics “avoid” engaging with his comparative charts (including Bitcoin versus gold and oscillator panels). The post frames an active debate: one camp flags RSI divergence risk; the other argues this cycle’s RSI and macro context support a different outcome.
Historical comparisons used to counter bearish chart view
Les F. Goh (@LesFGo) responded to Ali’s chart by posting a four-panel comparison featuring long-term price structures of the S&P 500, Nvidia, Bitcoin, and Apple. Each panel highlighted rounded basing patterns followed by major breakouts, challenging the idea that Bitcoin’s current curve must end in a top.
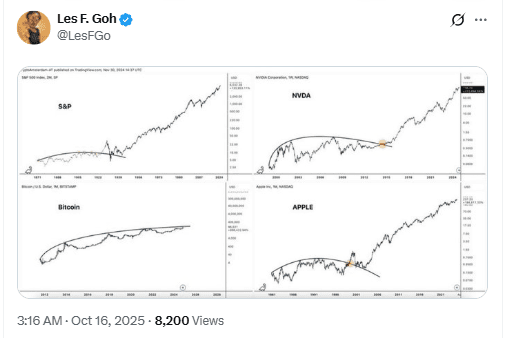
The S&P and Nvidia panels showed extended upward trends that persisted despite similar rounding formations. Apple’s panel illustrated a past period where a curved base preceded a breakout rather than a reversal. By placing Bitcoin’s current shape alongside these legacy charts, Goh implied that not all rounded structures signal exhaustion.
This response positioned the current Bitcoin chart within broader historical market behaviors. Instead of treating the rounded top as bearish by default, it suggested the pattern could align with extended bullish phases seen in other major assets over long timeframes.
Bitcoin forms rising channel pattern, hints at potential 80% upside if confirmed
The daily BTCUSD chart on Bitstamp shows Bitcoin trading inside a rising channel structure that has been forming since early 2025. The price has respected two parallel trendlines — an ascending support line and a matching ascending resistance line — repeatedly bouncing between them. A rising channel typically forms when price makes higher highs and higher lows within parallel boundaries. It often signals sustained upward momentum, but traders also watch for eventual breakouts or breakdowns from the structure to confirm direction.
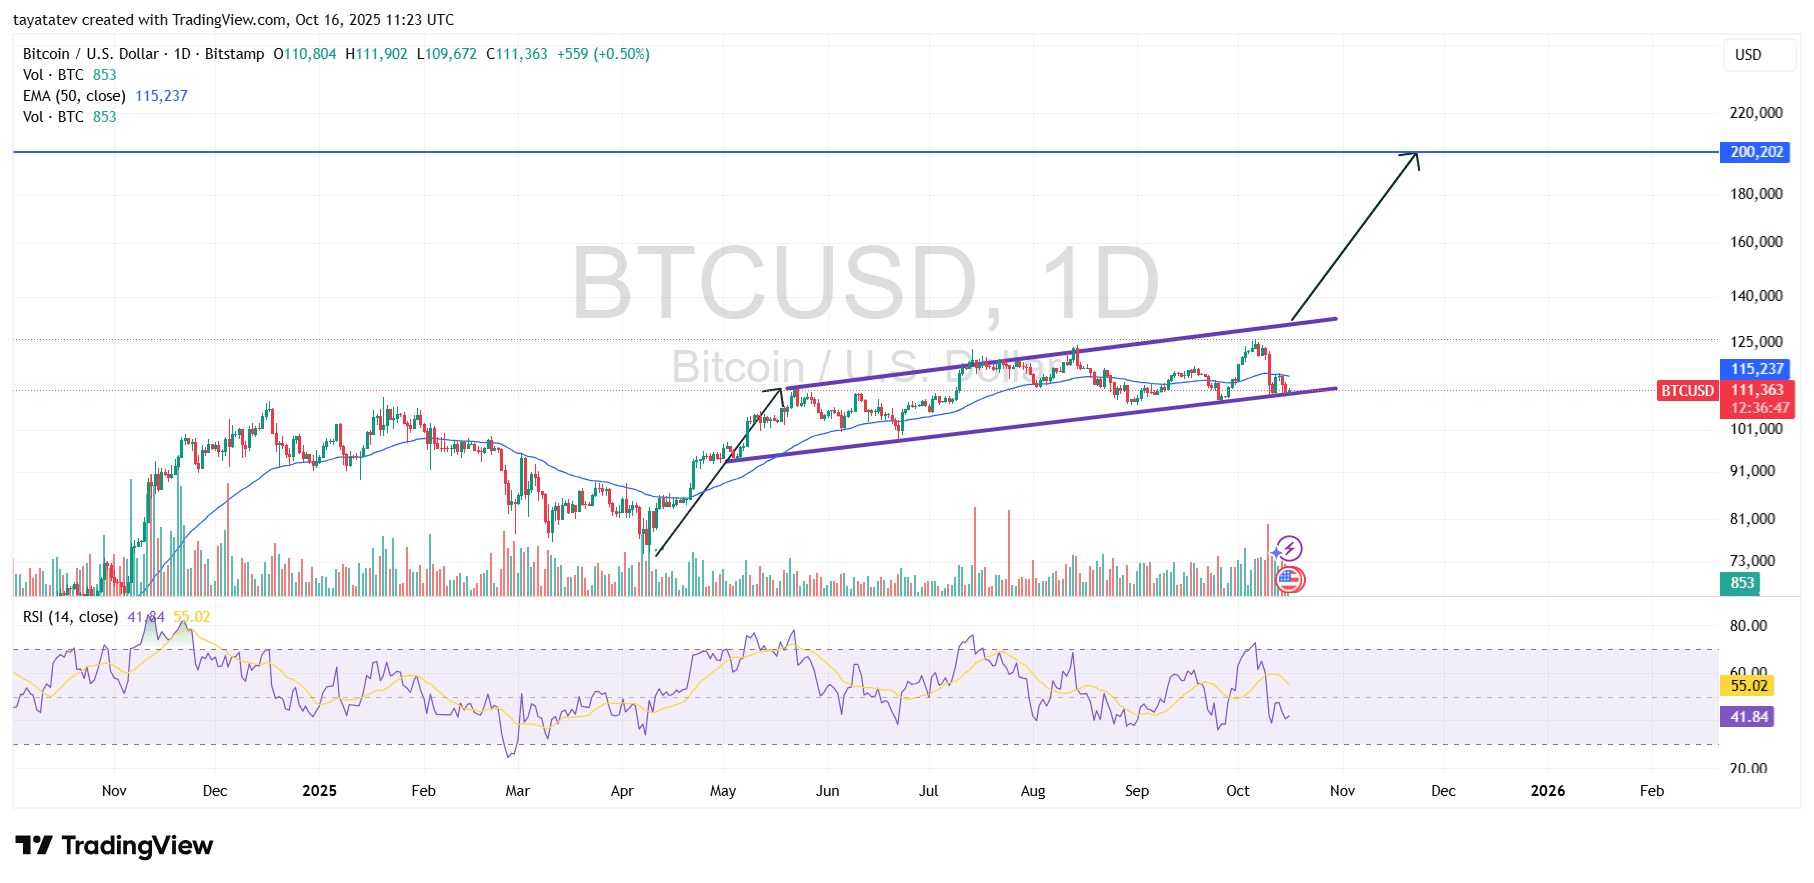
Currently, Bitcoin sits near the mid-range of the channel, slightly below the 50-day EMA at around $115,237. The RSI stands at 41.84, indicating momentum has cooled after the last push toward the upper boundary. However, the structure remains intact. If Bitcoin breaks above the channel’s resistance with strong volume, the pattern implies a measured move equal to the channel’s height added to the breakout point.
This projected move would represent roughly an 80% increase from the current price near $111,363, targeting approximately $200,202. That level aligns with the blue horizontal line on the chart, which likely represents a longer-term resistance or psychological milestone. If the breakout fails, the lower boundary remains the key support area traders will monitor for trend continuation or reversal. The setup shows a well-defined structure that could guide medium-term directional confirmation.
Binance BTCUSDT liquidation map highlights near-term wipeout zones
The CoinGlass liquidation map for Binance’s BTCUSDT perpetuals shows dense long-side liquidation clusters just above the current price around 111,000 to 113,000, with tall bars concentrated in the 25x–100x buckets. Cumulative long leverage (red curve) drops sharply into that band, signaling a pocket where forced long closures could cascade if downside resumes. Conversely, the cumulative short leverage (green curve) rises steadily from roughly 113,000 toward 122,000, indicating growing short exposure that could be squeezed if price climbs through those levels.
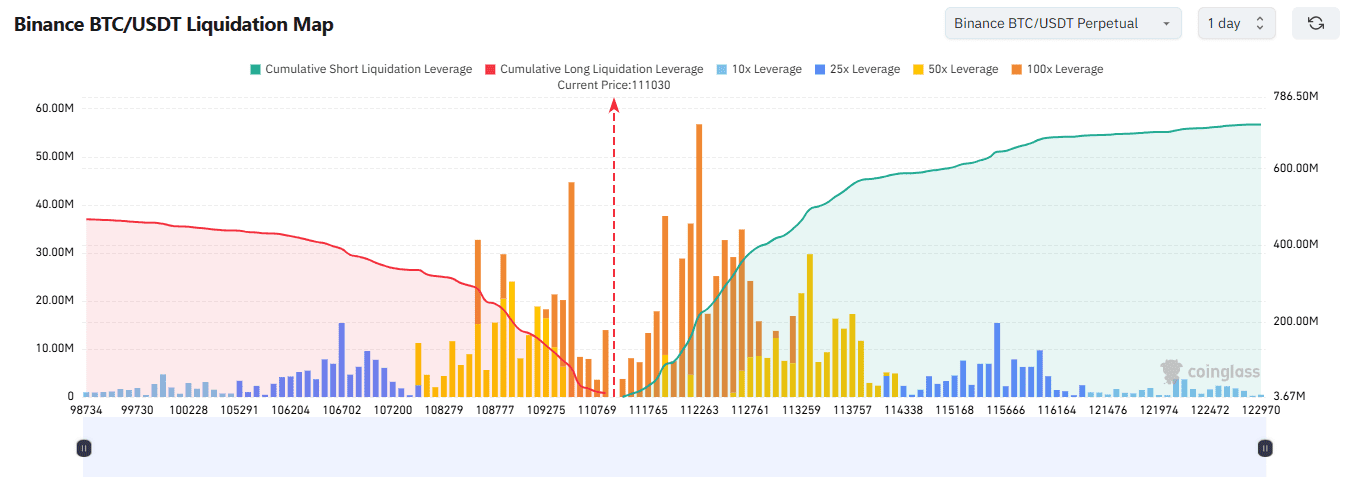
Because these maps aggregate exchange-reported liquidation levels, they visualize where highly levered traders are most vulnerable. In practice, liquidity often “attracts” price: moves into the 111,000–113,000 zone can trigger long liquidations, while pushes above ~115,000 toward ~120,000 increase the chance of short squeezes. The current layout therefore frames a tug-of-war between long liquidations below and short liquidations above, without asserting a directional call.