
UnityMeta Token (UMTUSDT) extended a multi-month decline and closed near 46.05, while the 50-day Exponential Moving Average (EMA) trended lower around 55.40. Price repeatedly failed beneath that EMA through summer, then, in early October, losses steepened as larger red daily candles appeared alongside heavier volume. The move confirmed persistent downside pressure and a clear break of prior consolidation.
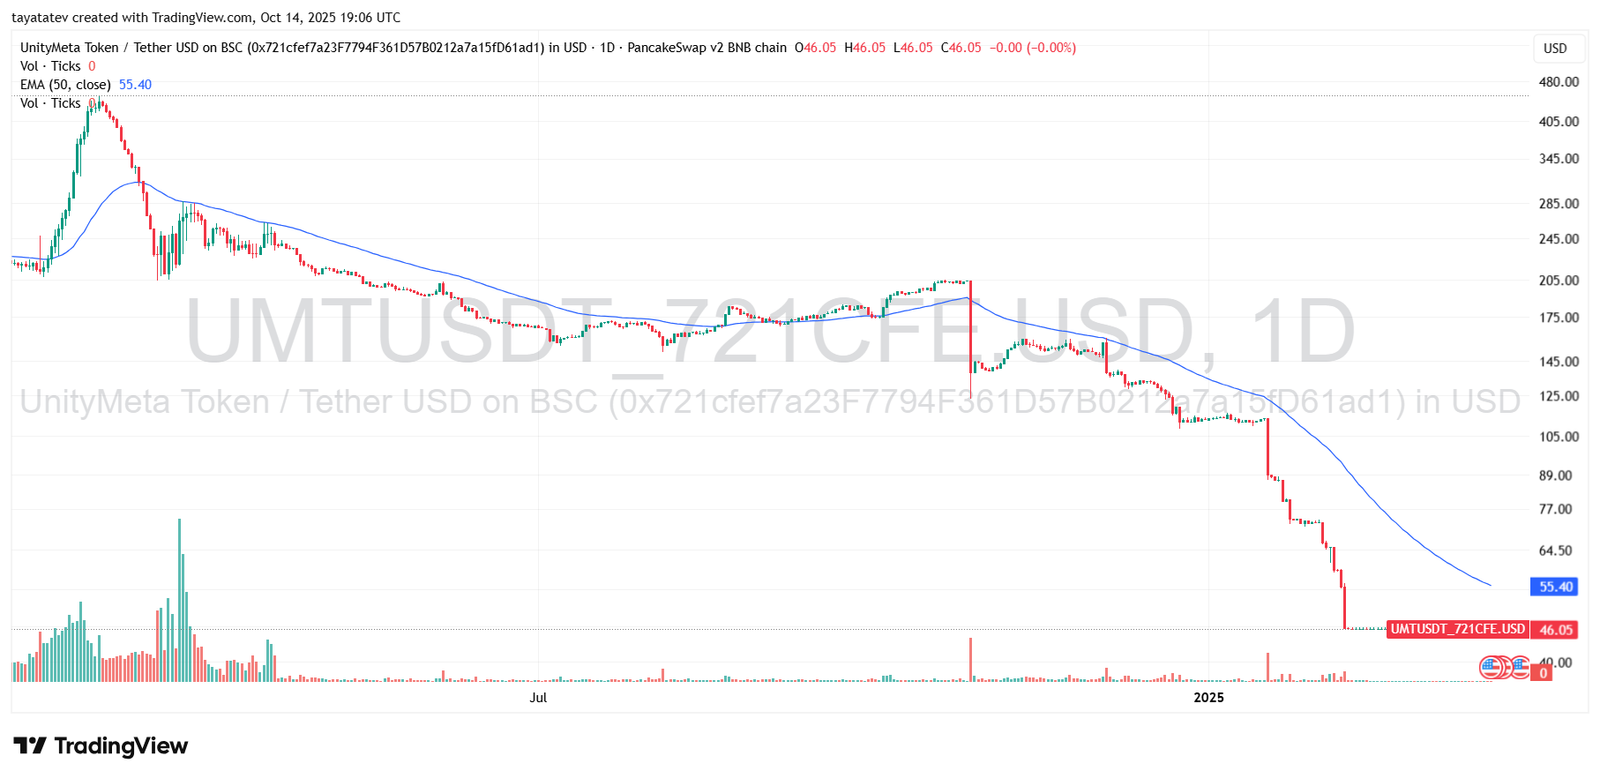
After the acceleration, the chart signaled late-stage capitulation rather than a completed base. Liquidity thinned, so single sessions produced outsized swings. Moreover, sellers defended every approach to the falling EMA, which kept momentum negative. Consequently, the trend remained firmly bearish into today’s session.
Looking ahead, trading desks expect consolidation to form between 40 and 60 while the market digests the drop. A daily close below 40 would expose 30–35 as the next support cluster from prior minor pauses. Conversely, a sustained close back above 55–60 for several days would mark the first “change in character,” opening room for a relief rebound toward 75–90, the last breakdown area. Until higher highs and higher lows print above the 50-day EMA, rallies are likely to face supply inside a primary downtrend.
UMTUSDT RSI: Extreme oversold, tentative uptick; confirmation requires a break above 30
The daily RSI sits near 13, deep in oversold territory, while the RSI average hovers around 7. Readings this low signal capitulation and exhausted momentum after a prolonged selloff. Moreover, the oscillator has spent several sessions below 20, which historically precedes short relief bounces rather than immediate trend reversals.
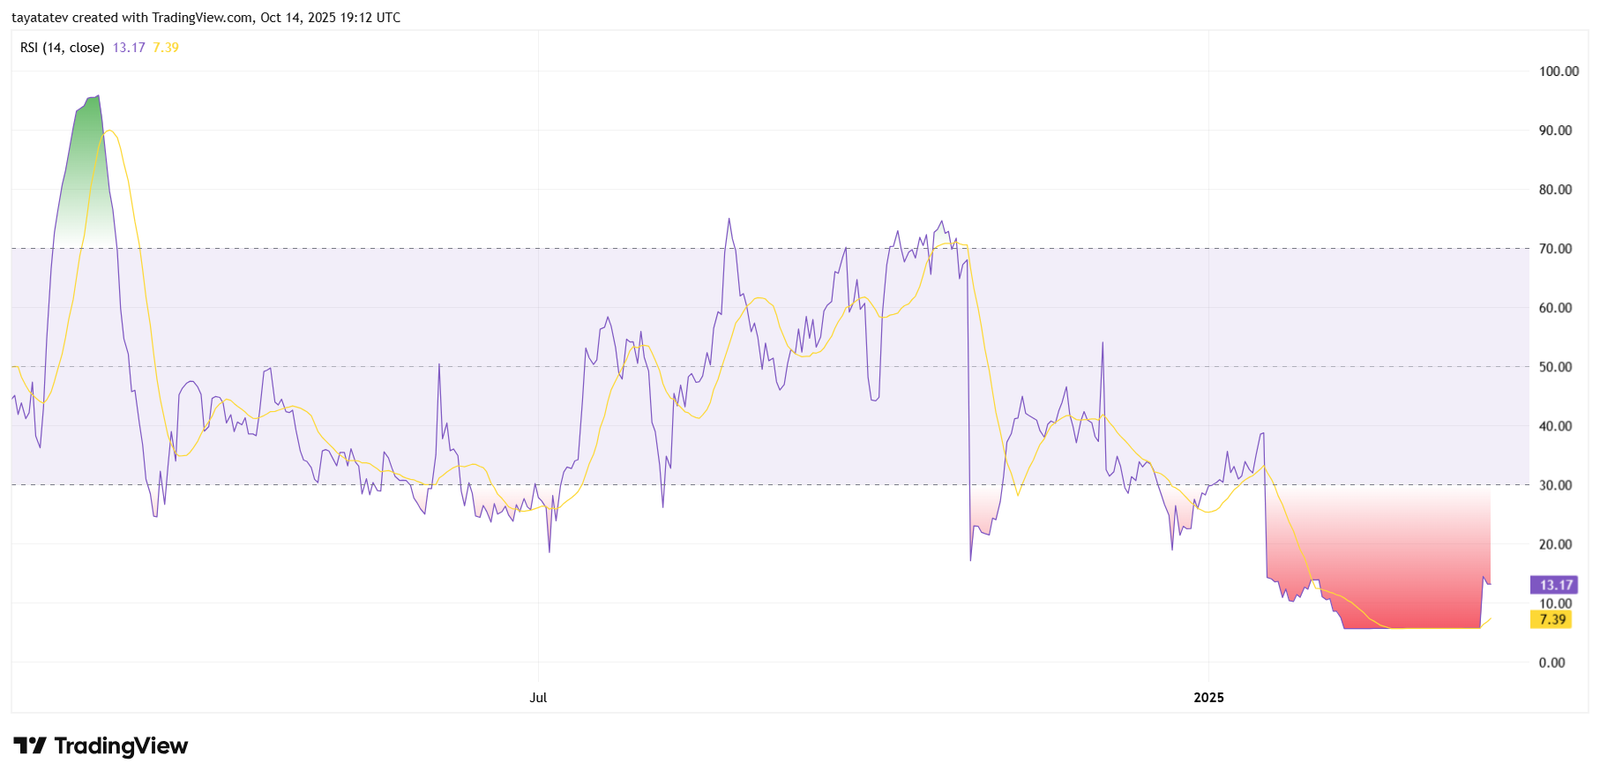
Recently, the RSI bounced off single-digit lows and ticked higher, hinting at fading downside pressure. However, the move remains unconfirmed because the oscillator still trades well below the 30 threshold that typically marks a momentum reset. Until RSI reclaims 30 and stabilizes, sellers retain control and rallies risk fading quickly.
Looking ahead, the baseline scenario favors consolidation with volatility spikes. A sustained push above 30 would open room for a rebound toward the 40–50 midpoint, where prior rallies failed. Conversely, a rollover back under 10 would reassert downside momentum and keep price vulnerable to fresh lows. Therefore, momentum confirmation hinges on consecutive closes of RSI above 30 and a rising RSI average that follows through.
UMTUSDT MACD: Bullish crossover below zero; momentum improves but trend not reversed
The daily MACD line has risen to about −1.35, now above the signal near −1.96, while the histogram prints slightly positive around 0.60. This bullish crossover confirms improving short-term momentum after October’s slide. Volume bars on the histogram also shrink on down days and expand on up days, which supports the shift.
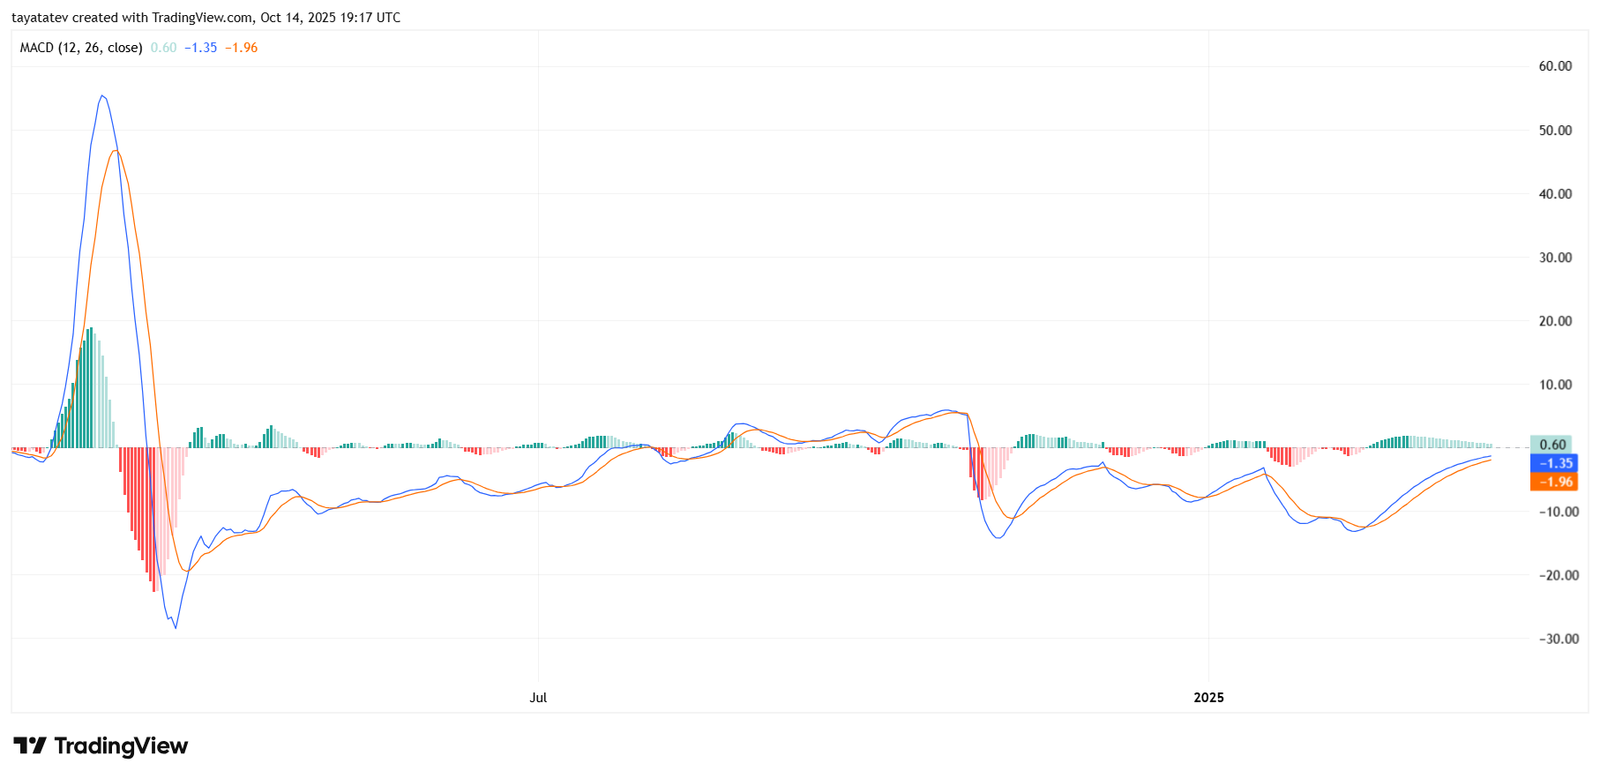
However, both MACD and signal remain below the zero line, so the broader trend still leans bearish. Historically, crossovers below zero often yield relief bounces rather than full reversals. Therefore, momentum must keep rising and cross into positive territory to validate a durable shift.
Looking ahead, sustained positive histogram readings would favor a grind higher toward the zero line. A roll-over of the MACD back under the signal would negate the signal and reopen risk of new lows. Consequently, confirmation hinges on a zero-line break with follow-through over several sessions and rising moving averages supporting price.