

Ethereum (ETH) dipped below the $2,000 psychological barrier on March 7, sparking concerns that the second-largest cryptocurrency might continue its downward trend as selling pressure continues.
The fact that Ethereum has broken below this barrier has sparked interest among investors who are keenly watching its possible targets.
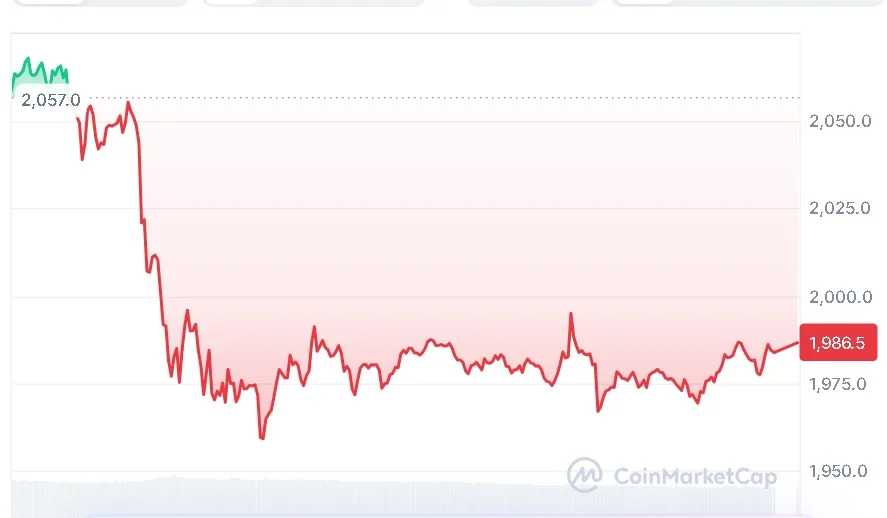
At the time of writing, Ethereum is trading at $1,986, with a 24-hour trading volume of $29.85 billion and a market capitalization of $239.43 billion, according to data from CoinMarketCap. The ETH has declined 3.73% over the last 24 hours.
Ethereum Breaks Key Support Level
In a recent market analysis shared by a crypto analyst, Ted, on March 7, 2026, the analyst noted the following: “Ethereum has now lost the $2,000 support zone.

The next level to watch will be the $1,850 to $1,900 zone, which will be the next support zone. If selling pressure continues, ETH will test this zone before any attempt to recover.”
Indicators Suggest Continued Selling Pressure
There are currently several indicators that suggest the market momentum of Ethereum is still weak in the short term. This is because the Relative Strength Index (RSI) is currently at 32.26, while the signal line is at 38.99. This means that the bearish pressure is still dominant in the market, and the buyers have still not taken strong control.
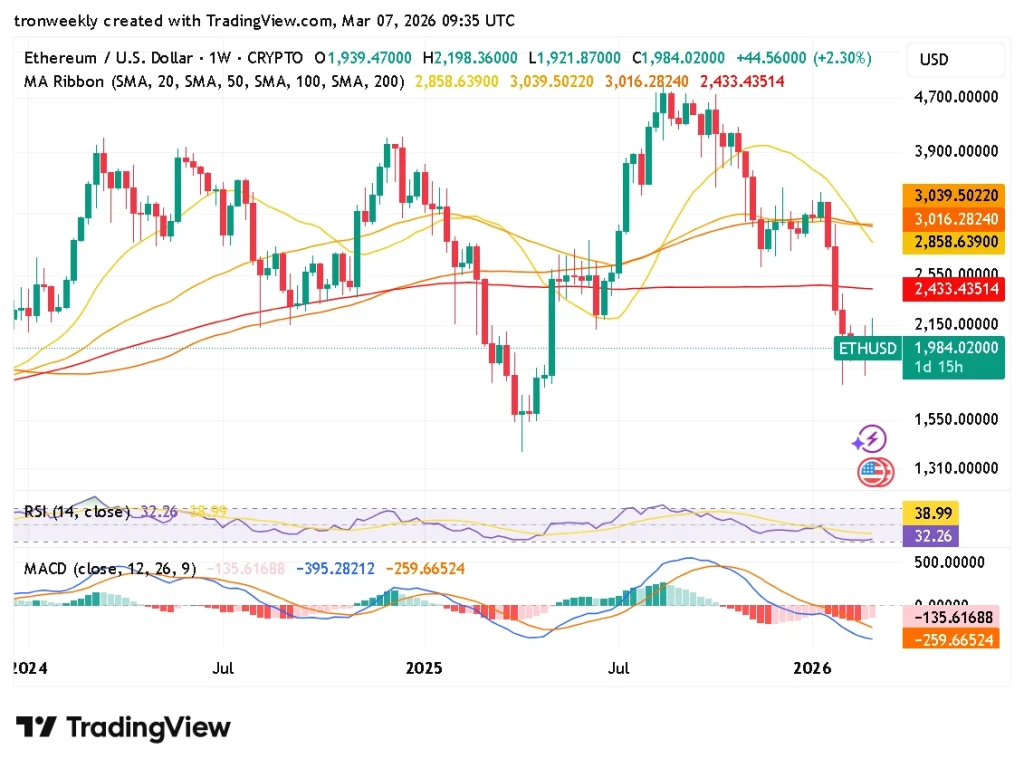
Ethereum is also trading considerably lower than the Moving Average Ribbon, thus reflecting the strength of the broad-based decline in the recent trading sessions.
The major moving averages are also considerably higher than the current price level, such as the 20-day moving average at $2,858, the 50-day moving average at $3,039, the 100-day moving average at $3,016, and the 200-day moving average at $2,433.
Moving Average Convergence Divergence, or MACD, also indicates that the price may continue to face pressure from the downside. As of now, the MACD line is at -395.28, which is still lower than the signal line, which is at -259.66. Also, the histogram is still in the negative territory at -135.62, which indicates that sellers are still in control.
Also Read | Solana (SOL) Pullback Hits Support Zone, Rebound Could Target $100
Ethereum Eyes Critical Reversal Zone
As ETH continues to trade below a major psychological level and technical indicators remain bearish, investors are waiting to see if the $1,850-$1,900 price range will be sufficient to halt the downward movement and create a possible catalyst for a price reversal.
Also Read | TRON Network Expansion Explodes in Q4 2025 With 900M+ Transactions