

Ethereum rebounds and whale activity signals renewed market confidence on Tuesday, March 3. According to the data from Lookonchain, the wallet 0xE1Ad withdrew 6,114 ETH ($12.52M) from OKX just three hours ago and deposited it into Aave, likely for yield or collateral use.
Such moves off exchanges often indicate accumulation rather than selling, suggesting that major holders see potential upside in Ethereum’s short-term recovery.
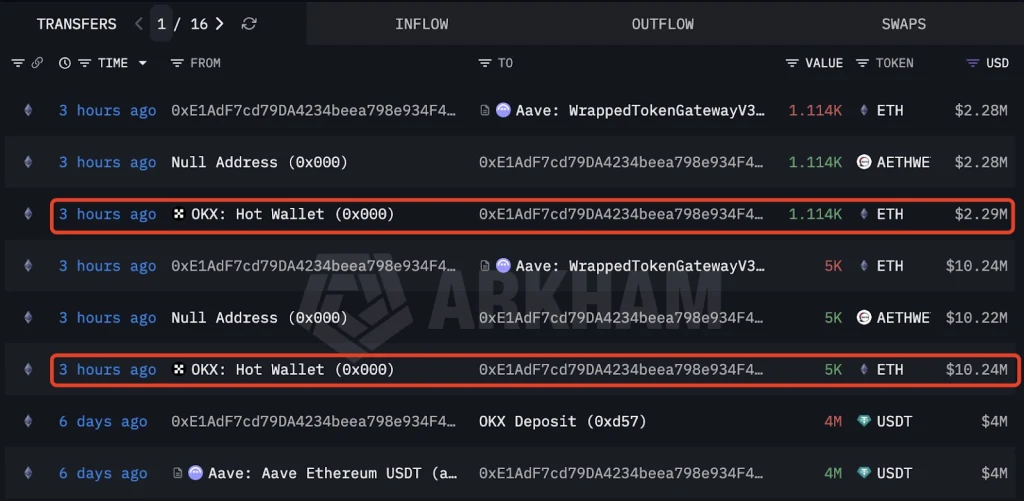
Source: Lookonchain’s X Post
After three months of dormancy, the 0x7673 and 0xBA9A wallets, believed to belong to the same whale, bought 5,350 ETH ($10.93M) at $2,043. This highlights the increasing confidence of the whales.
Experts observe that the whale activity indicates the beginning of a bullish run for the price of Ethereum, while the DeFi deposits suggest the whale’s strategy to leverage the assets.
Also Read: Ethereum Exchange Reserves Drop to 16 Million ETH
ETH Consolidates Around $2,000 After Sharp Sell-Off
Despite the on-chain milestones, Ethereum (ETH) has experienced a significant drop from the $3,300 mark and is currently trading around the $2,000-$2,100 range after a significant amount of selling, according to a crypto analyst named Cyril-DeFi, on Tuesday, March 3.
The volume increased during the drop and then decreased, which is a normal phenomenon after a capitulation. Traders are focusing on the $2,300-$2,400 resistance level for ETH, which, if cleared, could trigger a bullish move for the cryptocurrency.
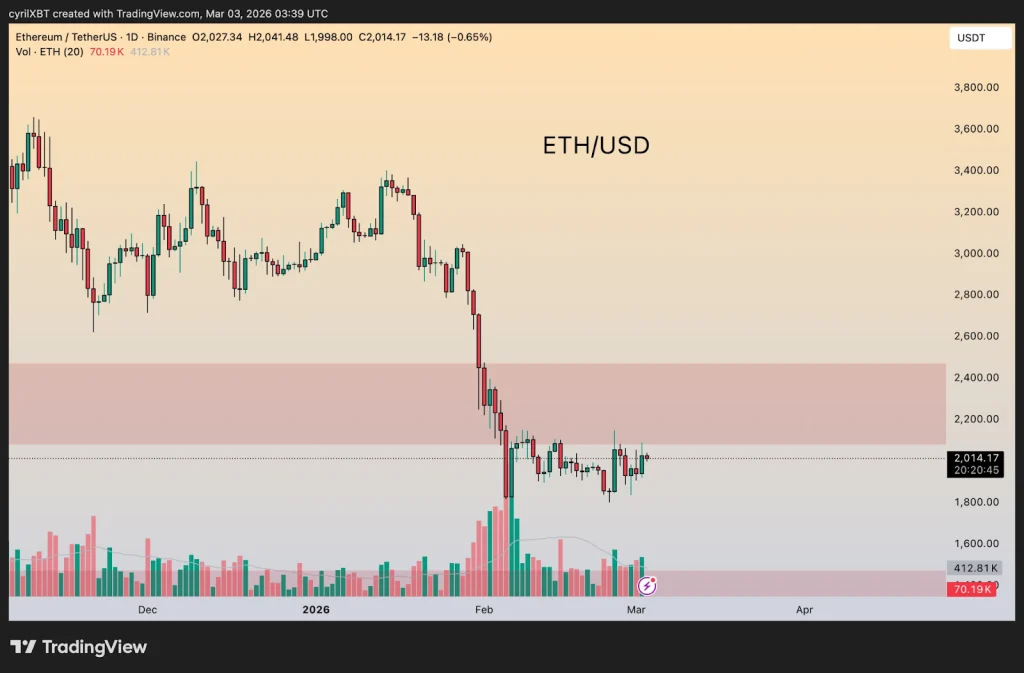
Source: Cyril-DeFi’s X Post
The immediate support is at $1,900, which is a major price level that, if breached, could potentially lead to further price declines towards the $1,700 to $1,800 liquidity areas. ETH is currently trading sideways in a consolidation pattern after the significant price drop.
According to Cyril-DeFi, the price direction of ETH is dependent on these major price levels, with the market sentiment dependent on the price action.
Momentum Indicators Point to Cautious Outlook
According to TradingView, as of Tuesday, March 3, the RSI is currently at 42.51, slightly below the neutral level of 50. This suggests that Ethereum is in a slightly bearish to neutral momentum position.
While the selling is subsiding after the sharp fall, bullish momentum is not yet high. The 14-day RSI moving average is at 37.80, which suggests a recent rally from the oversold levels of February, which is in sync with the current consolidation.

Source: TradingView
The MACD is confirming this slow recovery. The MACD line, which is currently at -99.02, is above the signal line, which is currently at -134.04. This is a bullish crossover.
The MACD histogram is currently at 35.02, which is a sign of increasing bullish energy from a deep negative. As such, the downtrend of Ethereum is slowing down, but the trend is weak.
Also Read: Ethereum’s Next Major Upgrade Could Redefine Power in Block Production