
ETHZilla said it sold about $40 million in ETH to finance share repurchases. The company framed the move as part of its board-approved buyback program. It aims to reduce the gap between market price and net asset value.
Moreover, the firm indicated the repurchases would occur in the open market. It cited prevailing prices and liquidity as key factors. It also referenced previously disclosed treasury levels.
Additionally, the release positioned buybacks as capital-allocation discipline. It pointed to volatility across crypto markets. It highlighted the flexibility of converting digital assets to cash when needed.
Market reaction and bearish concern
Traders quickly debated the signal this sale sends. Some noted that selling core treasury assets can pressure spot markets. Others argued the buyback could lift shares while ETH absorbs the flow.
However, bears stressed a negative feedback loop risk. They warned that repeated treasury sales could weigh on confidence. Theyflagged the potential for copycat actions across listed crypto treasuries.
SalsaTekila captured that view bluntly:
“This is extremely bearish, especially if it invites similar behavior.
ETH treasuries are not Saylor; they haven’t shown diamond-hand will.
If treasury companies start dumping the coin to buy shares, it’s a death spiral setup.”
Key variables to watch next
First, execution pace matters. Larger, faster sales could pressure ETH more visibly. Slower, staggered activity may soften impact.
Second, relative valuation will steer decisions. If the stock trades well below NAV, boards may prefer buybacks. If the discount narrows, treasuries may slow sales.
Third, disclosures will guide the narrative. Forthcoming filings can confirm sale sizes and timing. They can also show remaining ETH balances and cash levels.
Consequently, desks will track liquidity, block prints, and any program updates. They will also monitor peers for similar moves. Finally, they will watch ETH’s order book for signs of persistent supply.
ETH — Daily chart, Oct 28, 2025
Ethereum prints a bullish flag since mid-August, with falling parallel trendlines capping a tight consolidation while price holds above the 50-day EMA near $4,127. A bullish flag is a brief, downward-sloping pause after a strong rally that often precedes trend continuation. Today’s candle sits around $4,116 with the upper flag line near ~$4,600–$4,650 and the lower boundary near ~$3,650–$3,700.
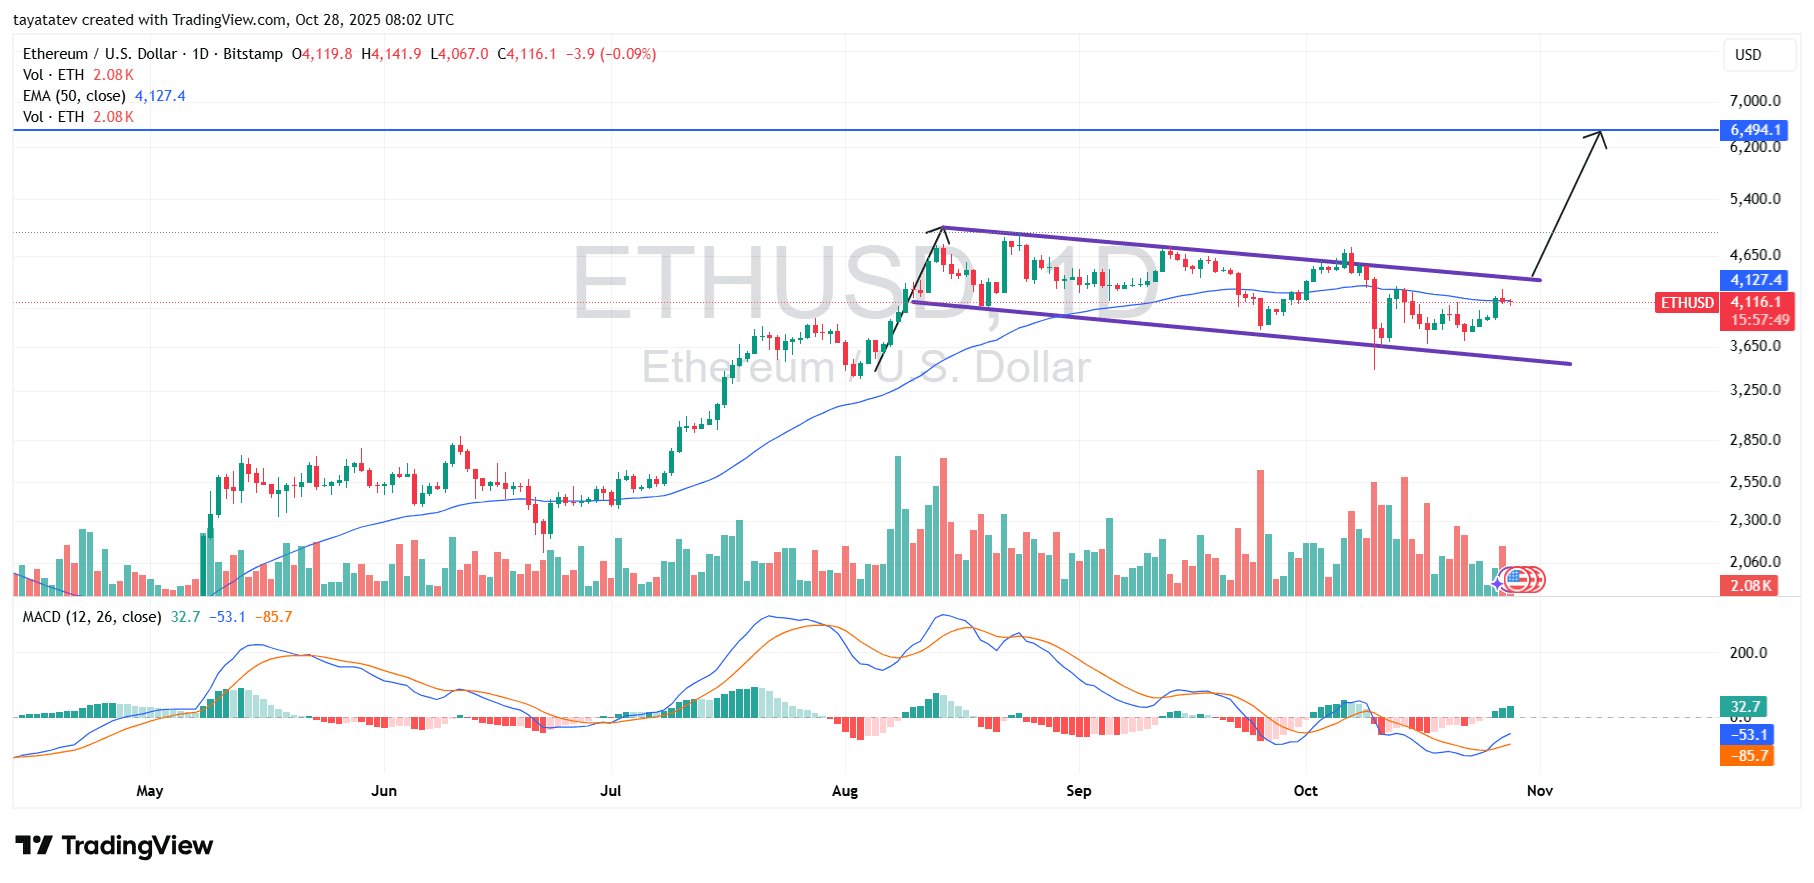
Moreover, momentum improves. The MACD histogram flips positive and the MACD line turns up toward a potential signal-line cross, while recent green volume bars tick higher; however, confirmation still requires a clean daily close above the flag’s upper trendline with expanding volume. Until that break, the structure remains a setup, not a completed reversal or continuation.
If Ethereum confirms the breakout, the measured move projects roughly 57% above the current price, implying a target around ~$6,462 (in line with the ~$6,494 level marked on the chart). Conversely, a decisive loss of the lower flag boundary would invalidate the pattern and expose supports toward ~$3,700 and the prior cluster around ~$3,400. Therefore, watch for: 1) a daily close above ~$4,600–$4,650, 2) rising volume on the breakout, and 3) MACD follow-through while the 50-day EMA holds as support.