
A softer labor market can weaken the dollar and ease yields—two shifts that often support Bitcoin. This week’s U.S. jobs lineup concentrates that risk into four prints that can quickly reset rate-cut odds and liquidity expectations.
Bitcoin increasingly trades against macro signals rather than crypto-only headlines. In that setup, labor data can overshadow inflation releases because hiring, wages, and layoffs feed directly into the Federal Reserve’s path. Therefore, each report below can nudge policy expectations and, in turn, short-term and longer-term Bitcoin sentiment.

Traders will parse direction first, then magnitude. Cooling indicators tend to bolster risk assets through a weaker dollar and lower yields. However, an abrupt slump can raise recession concerns and spark near-term volatility before any liquidity tailwind forms.
Why the week’s jobs data matter for Bitcoin
Labor prints anchor the market’s view on growth, wages, and inflation pressure. When they cool in an orderly way, markets price easier policy. That repricing often lowers real yields and the dollar, supporting liquidity-sensitive assets such as Bitcoin.
Moreover, these releases arrive in a tight sequence. As a result, narrative momentum can build across the week. A consistent cooling signal can strengthen the case for additional easing, while a mixed tape can keep ranges intact and focus attention on the next print.
Finally, Bitcoin reacts not only to the numbers but also to what they imply about financial conditions. Dollar direction, front-end yields, and liquidity proxies often transmit the macro signal into BTC price action faster than sector-specific news.
JOLTS: Openings drift lower, signaling cooler demand
The Job Openings and Labor Turnover Survey (JOLTS) opens the week. It tracks job openings, hires, and separations, offering a direct read on labor demand. Markets watch the openings line most because it links to wage pressure and overall overheating risk.
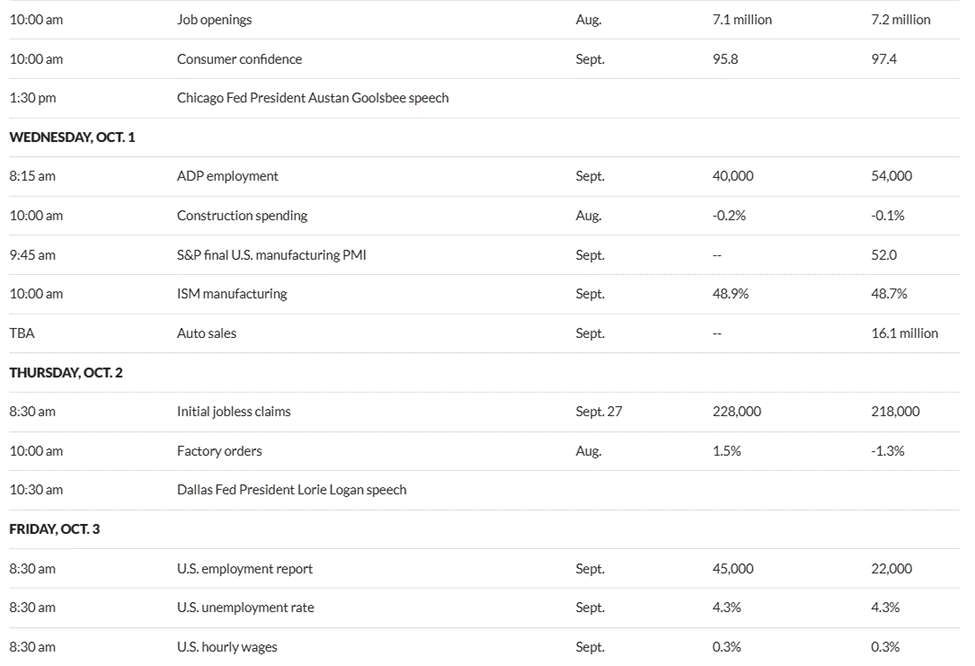
Recent JOLTS reports showed openings at 7.8 million in May, 7.4 million in June, and 7.2 million in July. Economists expect August to ease again toward 7.1 million, which would mark a fourth monthly decline. That pattern points to cooler demand and less wage tension.
For Bitcoin, an orderly step down typically leans bullish through a softer dollar and easier yields. However, an upside surprise could revive a “higher for longer” stance and stall risk appetite. Traders will also note any shift in quits and hires to confirm the demand trend.
ADP Employment: Private hiring slows, liquidity case builds
ADP’s private-payrolls report follows midweek. It captures client payroll data and often sets the tone ahead of Friday’s official report. While not perfect as a predictor, it can move yields and the dollar on its own.
Consensus looks for a September gain near 40,000 after 54,000 in August and 104,000 in July. That sequence suggests continued cooling in private hiring. It also implies less immediate wage pressure, which markets usually treat as dovish for policy.
For Bitcoin, softer ADP outcomes often support a pro-liquidity tilt. A weaker dollar and easier front-end yields tend to help BTC. Still, if the slowdown appears too sharp and triggers recession fears, crypto can see choppy trading before any liquidity narrative reasserts.

Initial jobless claims: Weekly pace tests resilience
Initial jobless claims arrive on Thursday and provide the timeliest read on layoffs. The prior week printed 218,000. Economists expect a modest uptick toward 228,000, which would still sit near historical expansion ranges.
A gradual rise signals slower demand without acute stress. Markets usually read that as consistent with easier policy over time. Consequently, risk assets can benefit through gentler financial conditions and a softer dollar backdrop.
However, traders will focus on the trajectory. A one-off rise carries less weight than a sustained climb. A persistent uptrend would point to weakening growth, which can increase volatility across crypto even as rate-cut odds climb.
Friday employment report: Headline growth vs. steady unemployment
The week culminates with the official employment and unemployment reports. Forecasts point to 45,000 new jobs after 22,000 the prior month, with unemployment holding at 4.3%. That mix signals modest hiring alongside persistent slack.
Markets often view that profile as neutral-to-dovish. Growth remains, but a steady jobless rate hints at cooling demand. In policy terms, it preserves room for the Fed to lean accommodative if inflation cooperates.
For Bitcoin, that outcome can support a mild risk-on tone through rate-cut expectations. The dollar and front-end yields would guide the immediate reaction. Stronger-than-expected hiring could mute that impulse, while a sharp miss could spark volatility before any liquidity bid emerges.
What this setup means for BTC in practice
Across these releases, the transmission channel into Bitcoin stays clear: dollar direction, real yields, and liquidity. When prints cool in a controlled way, those channels often tilt supportive for BTC. Conversely, upside surprises or disorderly weakness can stall or jar price action.
Therefore, the narrative hinge is consistency. If JOLTS, ADP, and claims align with a cooler theme and Friday does not break the pattern, policy expectations can drift dovish and improve crypto’s backdrop. Mixed signals would likely extend ranges and push focus to the next macro catalyst.
In short, this week’s jobs run-rate can reset the macro frame for Bitcoin faster than sector headlines. Traders will watch the sequence, the surprise components, and the market’s read on financial conditions to gauge whether BTC’s bias tilts risk-on or stays constrained.
BTCUSD Rising Channel — Chart dated Sep 29
The Bitcoin to United States Dollar (BTCUSD) daily chart from TradingView on Bitstamp is timestamped Sep 29. Price prints near 112,147 United States Dollars while the 50-day Exponential Moving Average (EMA) sits around 113,284 United States Dollars, so Bitcoin trades roughly one percent below that trend gauge. The chart shows price oscillating inside a rising, parallel channel drawn since late spring, with support rising beneath recent lows and resistance tracking a series of higher highs toward the mid-130,000s. A rising channel is a structure formed by two upward-sloping, parallel trendlines that contain price swings into higher highs and higher lows. Because price currently hovers just above the channel’s lower boundary and just below the 50-day Exponential Moving Average, traders will watch whether buyers defend rising support and then reclaim the moving average, since those steps often keep the trend intact.
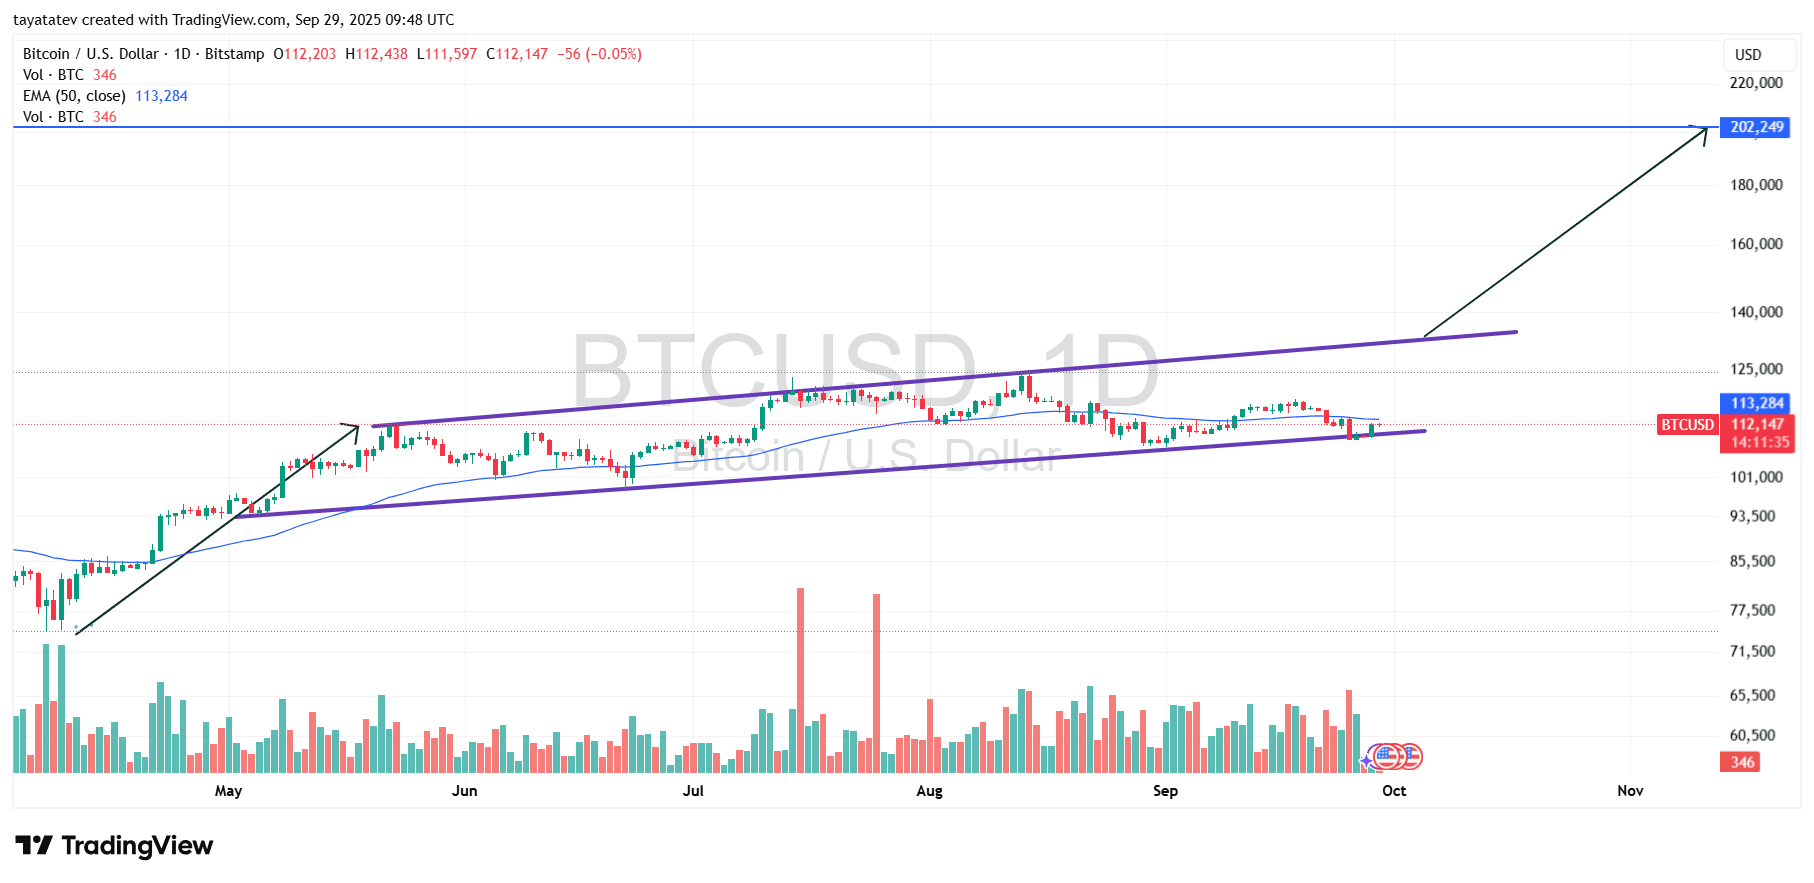
Moreover, the pattern communicates directional bias more than magnitude. While an intact channel signals persistent demand and orderly pullbacks, it does not, by itself, validate outsized upside objectives. Typically, confirmation of an acceleration requires a decisive breakout above the channel’s upper rail on expanding volume and then follow-through that holds above former resistance. Until such a breakout appears, the default expectation is continued mean-reverting travel inside the channel, with dips toward lower rail support and rallies that fade near the upper boundary.
Finally, the chart annotates an aspirational arrow toward roughly 202,249 United States Dollars. An eighty percent advance from today’s spot would project to about 201,865 United States Dollars (112,147 × 1.8 ≈ 201,865), which aligns closely with that marked level. However, the rising channel pattern does not confirm an eighty percent move on its own; it only frames a bullish path that would require a clean break above the upper rail, a sustained hold above that breakout area, and supportive macro conditions. In practical terms, the channel presently argues that the uptrend remains orderly while price respects rising support, whereas an confirmed topside escape would be the technical trigger that upgrades the probability of reaching the ~202,000 United States Dollars area.
BTCUSD MACD — Chart dated Sep 29, 2025
The Bitcoin to United States Dollar Moving Average Convergence Divergence indicator on the daily timeframe shows momentum turning negative into the week. The Moving Average Convergence Divergence line (blue) sits around minus six hundred seventy-six, the signal line (orange) near minus two hundred seventy-six, and the histogram near minus three hundred ninety-nine. Because the Moving Average Convergence Divergence line is below the signal line and both are below the zero axis, bearish momentum dominates in the short term. The most recent crossover occurred to the downside in late September, flipping the histogram from green to red. That shift confirms a loss of upside impulse after the early-September bounce and aligns with price slipping under the fifty-day Exponential Moving Average on the accompanying price chart.
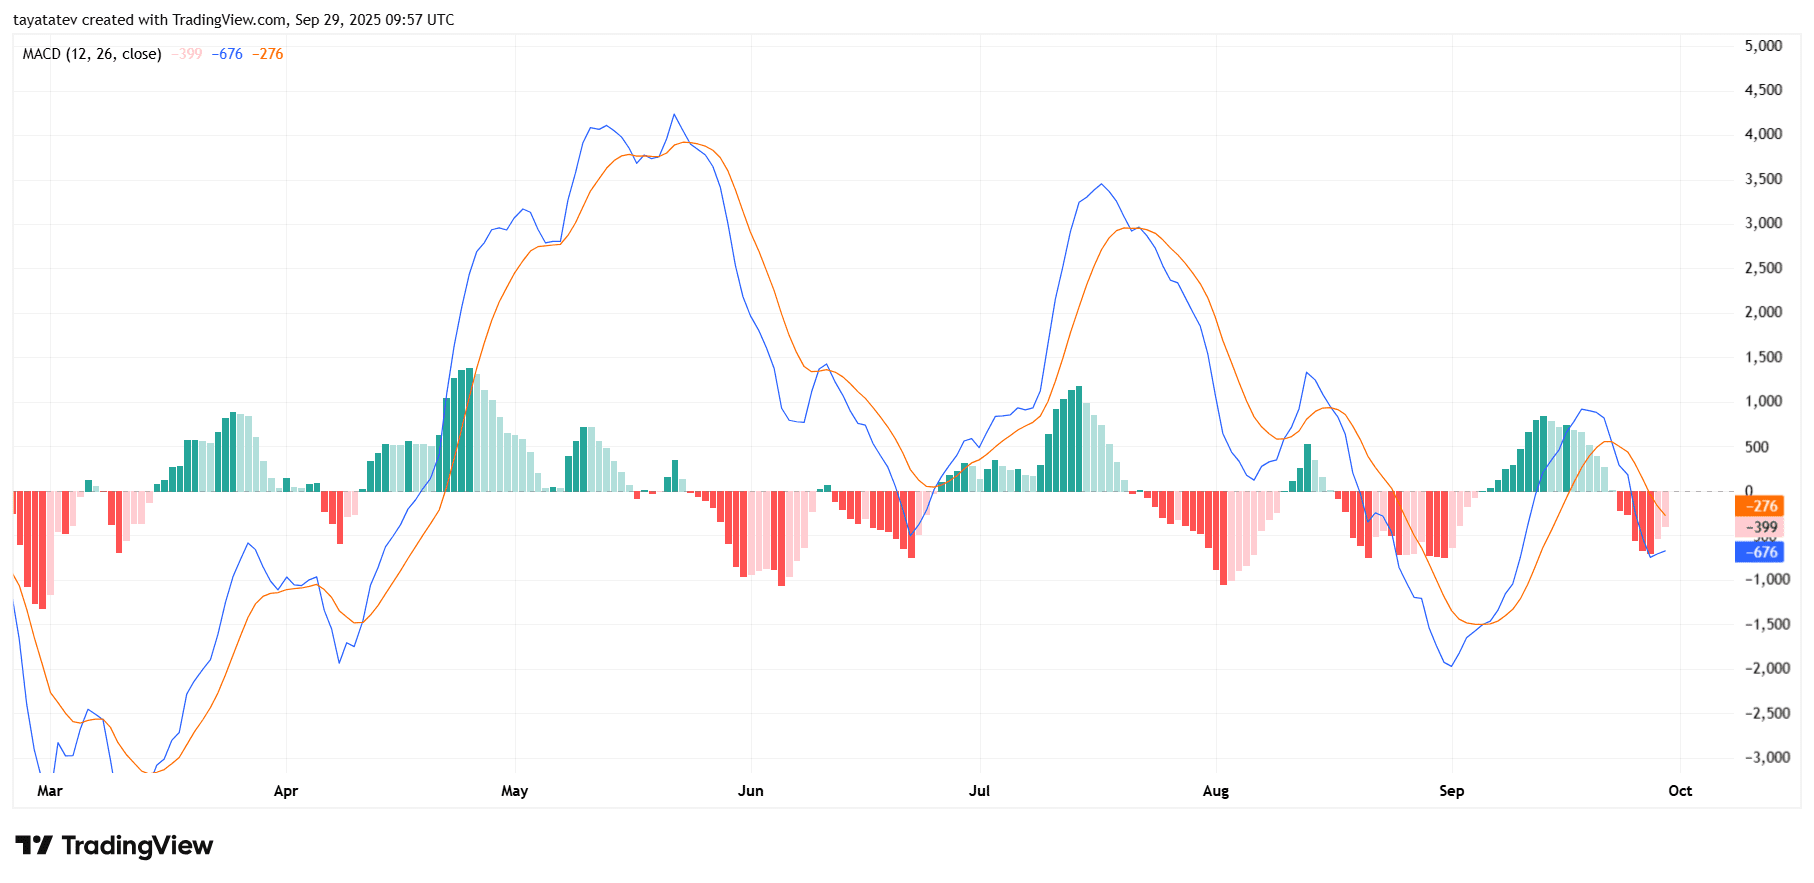
However, the setup is close enough to the zero axis that momentum can inflect quickly if buyers reclaim trend control. A constructive reversal would first appear as shrinking red histogram bars, then a fresh bullish crossover where the Moving Average Convergence Divergence line rises above the signal line, and finally a move back above the zero axis to re-establish positive trend energy. Until those conditions print, the indicator argues for continued mean reversion or drift within the rising price channel rather than immediate acceleration. In practice, Bitcoin needs improving breadth and higher daily closes to pull the Moving Average Convergence Divergence line up; without that, negative momentum can persist and cap rallies near resistance.
BTCUSD RSI — Chart dated Sep 29, 2025
The Bitcoin to United States Dollar Relative Strength Index on the daily timeframe prints near 47.06 with its simple moving average of the Relative Strength Index around 49.06. Because the Relative Strength Index sits below its midline at 50 and below its own average, momentum leans slightly bearish. However, both readings hover close to neutral territory, so direction can flip quickly on modest price changes. The oscillator also remains far from the 30 oversold zone and the 70 overbought zone, which signals balanced conditions rather than exhaustion at either extreme.
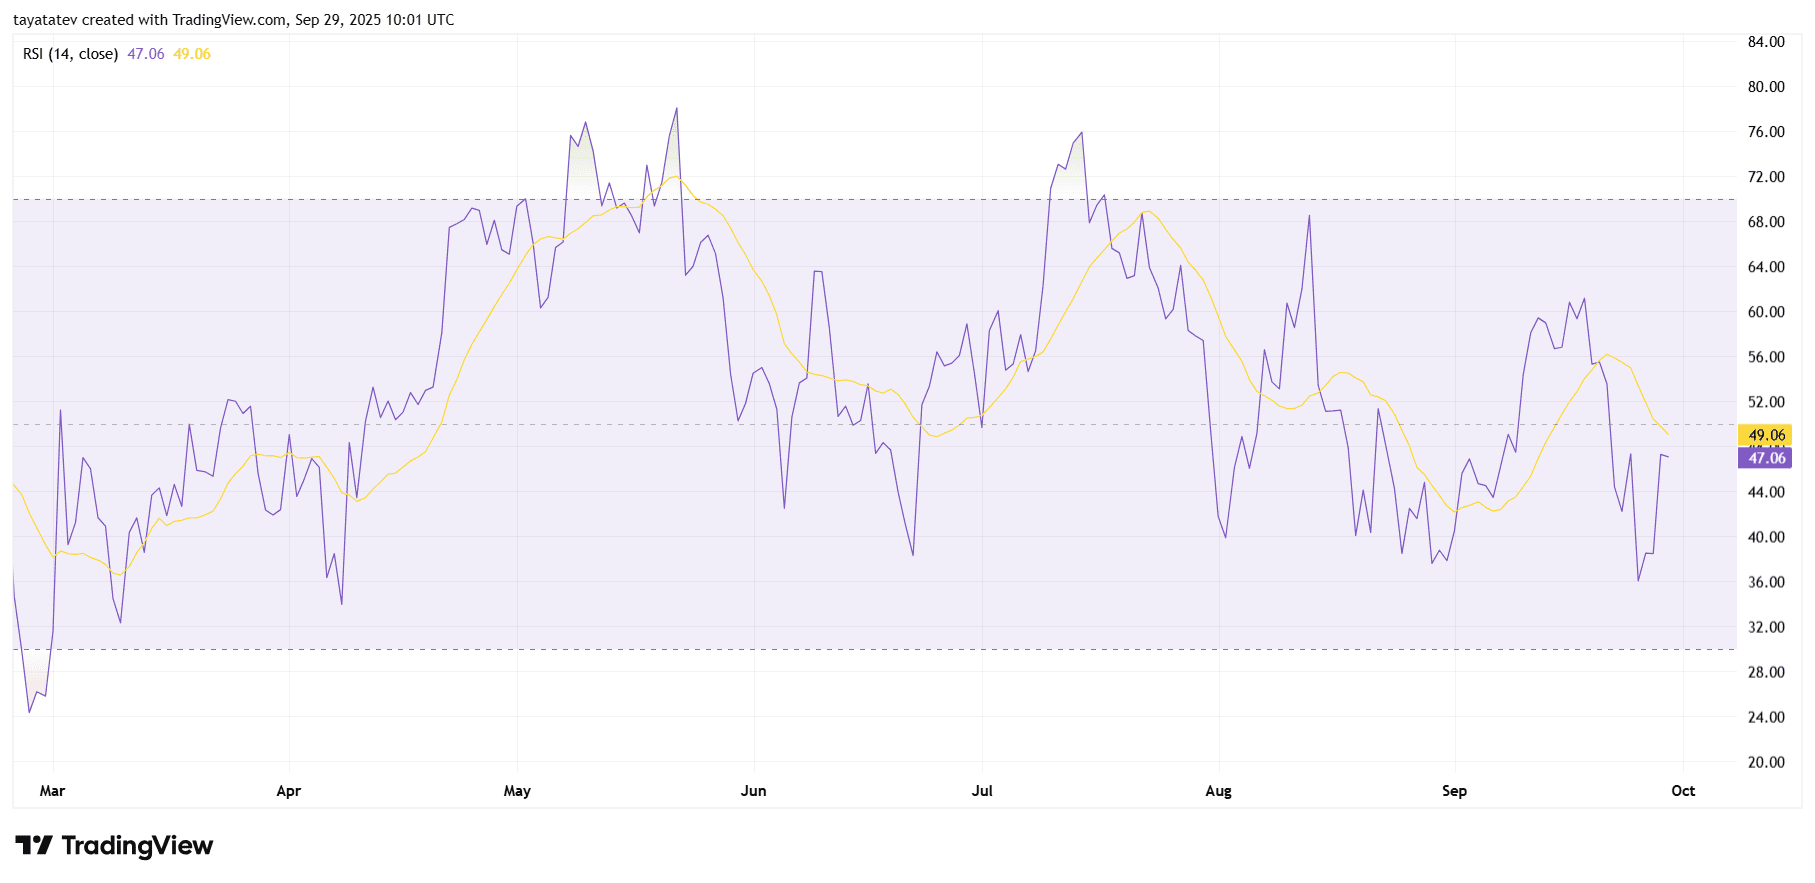
Recent swings show the Relative Strength Index failing to sustain above 60 through September, then rolling over as price slipped under the fifty-day Exponential Moving Average on the companion chart. That rollover aligns with a loss of upside impulse and explains why rallies faded before retesting the channel’s upper rail. Still, the Relative Strength Index has started to stabilize above the low-40s, which often precedes range trading inside an uptrend channel when buyers defend higher lows.
Going forward, a constructive turn would feature the Relative Strength Index reclaiming 50 and crossing back above its simple moving average while holding a sequence of higher troughs. That behavior typically accompanies price reclaiming the fifty-day Exponential Moving Average and riding the rising channel’s midline. Conversely, a decisive break below 40 with expanding downside breadth would warn that sellers control momentum and raise the risk of a test of the channel’s lower boundary. In short, momentum sits neutral-to-soft today, and Bitcoin needs stronger closes to push the Relative Strength Index back above 50 to reassert bullish control.