
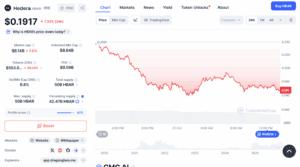
Hedera (HBAR) Hashgraph’s price fell 7% today on Oct. 31 even as its new U.S. spot ETF logged about $29 million in daily inflows, the largest since launch. It seems traders booked profits after the early rally that followed the ETF’s debut earlier this week.
ETF Inflows Jump After a Slow Start
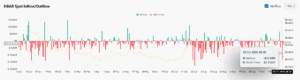
Data from SoSoValue showed the Canary Capital HBAR Spot ETF, listed on Nasdaq under the ticker HBR, added $29.9 million in inflows on Oct. 30, up from $2.2 million the previous day. That brought total inflows to $32.1 million and net assets to $33 million, with $2.26 million in trading volume.
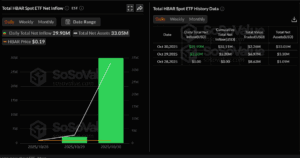
The ETF, which launched on Oct. 28, had started with no inflows on its first day — a slow debut before institutional participation began to pick up.
Even with growing ETF inflows, HBAR price slipped below $0.20 after rising 22% earlier in the week. The token reached $0.22 on Oct. 28 before easing back as short-term traders cashed out.
ETF inflows shows long-term institutional allocations and don’t always lead to direct spot-market buying. At the same time, retail traders who bought the rumor of the ETF launch began taking profits once the listing became official.
CoinGlass data showed $12 million in outflows from centralized exchanges on Oct. 30, suggesting a pause in new accumulation of Hedera.
Apart from HBAR, Solana’s Bitwise BSOL ETF saw $37.3 million in inflows on Oct. 30, bringing its cumulative total to $154.7 million and $439.9 million in total assets. Litecoin’s LTCC ETF recorded no new inflows and held steady at $1.34 million in assets.
Hedera’s decline came amid a broader drop in cryptocurrencies after hawkish comments from the Federal Reserve spurred redemptions in major funds. Bitcoin ETFs lost $488 million and Ethereum ETFs $184 million on Oct. 30. Specifically, the broader sell-off weighed on smaller assets, including newly listed altcoin ETFs.
HBAR Eyes Rebound, But Resistance Remains Firm
HBAR token traded near $0.193 on Oct. 31, consolidating below its descending trendline after failing to hold above $0.208. That level aligns with the 200-day Exponential Moving Average (EMA), which now acts as resistance.
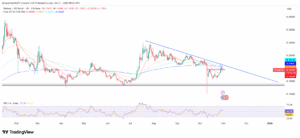
Support lies between $0.187 and $0.20, where the 20-, 50-, and 100-day EMAs overlap. A close below this range could open a move toward $0.17–$0.15, while a break above $0.21 would suggest a potential trend reversal.
The Relative Strength Index (RSI-14) hovered around 52, showing neutral momentum after the ETF-driven rally. If buying interest returns near the current support around $0.18–$0.19, HBAR could attempt another test of $0.21 in the short term.
Moreover, a confirmed close above that level may open upside targets near $0.23–$0.25, which coincides with the upper boundary of the current descending trendline.
However, failure to hold the $0.18 support could trigger a correction toward $0.16, especially if ETF inflows slow or broader market sentiment weakens.