
Hedera started its Sibos 2025 presence today, September 29, in Frankfurt, marking the first day of the four-day event. The booth, located at stand DISM67, is designed to host live discussions and demonstrations through October 2. The team is using the event to highlight Hedera’s role in tokenization, instant cross-border payments, and digital identity.
The opening day featured invitations for attendees to schedule meetings with Hedera experts. The company’s ecosystem partners also promoted the booth on social media, encouraging visitors to explore Hedera’s latest enterprise-grade solutions.

Hedera’s official event hub confirmed the booth’s location and listed a full schedule of activities. This ensures participants can engage with product managers, developers, and enterprise representatives throughout the conference.
Focus on Tokenization and Payments
A core part of Hedera’s Sibos presence is demonstrating tokenization use cases. The team is showing how its network supports tokenizing assets, from regulated financial instruments to real-world assets. These demonstrations aim to show banks and institutions how tokenization can streamline settlement processes and compliance.
Cross-border payments are another highlight. Hedera is presenting solutions for near-instant international transactions, offering lower costs and higher transparency compared to traditional systems. These sessions focus on the benefits for treasury teams and corporate clients seeking real-time liquidity.
In addition, Hedera is showcasing micropayment solutions for content creators and IoT applications. The network’s low-cost architecture allows for small-value transactions, which is not feasible on most blockchains.
Hedera Highlights Digital Identity and AI Integration
Digital identity is a key topic at Sibos this year, and Hedera is demonstrating verifiable credential solutions. These presentations explore how identity data can be issued, verified, and shared securely across financial ecosystems.
Hedera is also highlighting AI-related integrations, showing how agents can leverage Hedera’s consensus service for trusted event logging. This adds accountability to AI-driven decisions, a growing requirement for regulated industries.
The team plans to continue these demonstrations over the next three days, closing the event with a summary of enterprise adoption progress and ecosystem growth.
HBAR forms a bullish flag as momentum stabilizes
Breakout focus above the flag’s top
HBAR/USD trades inside a downward-sloping channel that resembles a bullish flag on the daily chart. Price rebounded from the lower boundary and now sits near $0.219 while the 50-day EMA hovers around $0.2296. Volume has contracted during the pullback, and MACD flattening suggests waning bearish momentum. Together, these signals point to a market that is pausing rather than reversing the prior uptrend.
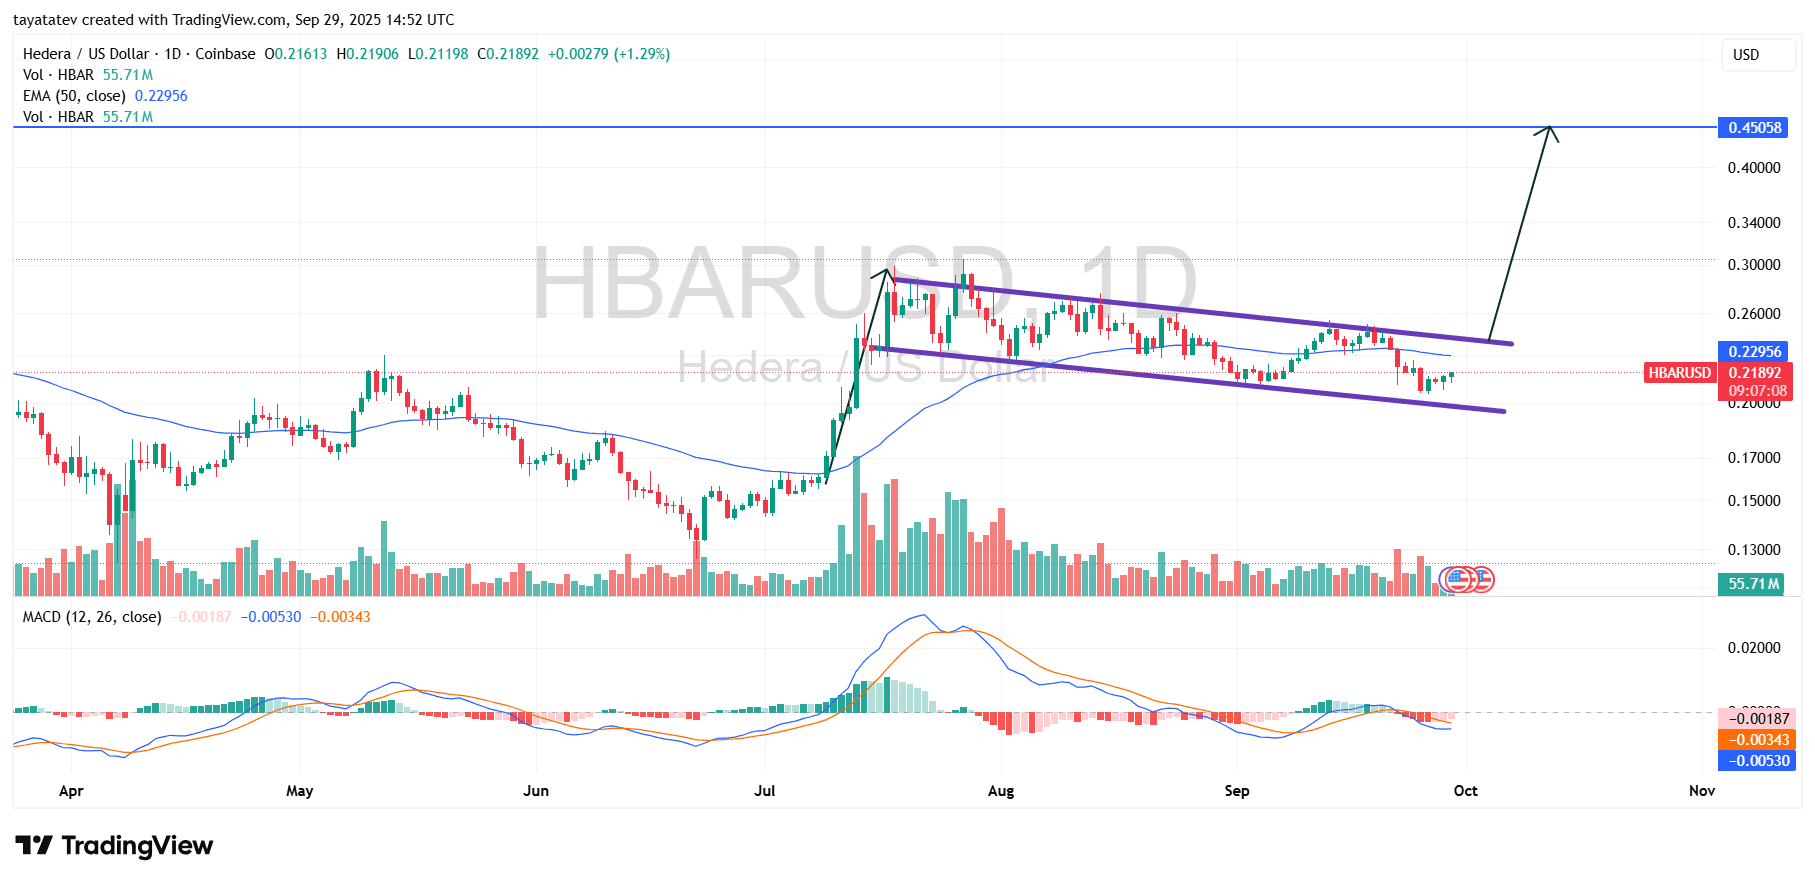
The flag’s resistance currently tracks just below $0.26. A daily close above that trendline, especially with rising volume and a reclaim of the 50-day EMA, would confirm a breakout. Until then, the lower boundary near $0.20 remains the key level bulls must defend to keep the pattern intact.
In this setup, the market has already shown the classic sequence: a sharp advance, then an orderly, downward consolidation inside parallel lines. The structure keeps making lower highs and lower lows within the channel, yet it does so on lighter activity than the initial surge. That behavior often precedes a continuation push.
What a bullish flag means—and the upside if confirmed
A bullish flag is a continuation pattern. First, price “poles” higher in a steep move. Then, it consolidates in a small, falling channel as traders digest gains. Finally, a strong break above the flag’s top indicates that buyers have regained control and are ready to extend the prior trend. The measured move typically projects by adding the flagpole height to the breakout area.
If HBAR confirms with a decisive close above the flag and holds retests, the chart points to a target near $0.4506. That level sits about 106% above the current price around $0.219. The line at $0.4506 is visible on the chart and aligns with a classic measured-move objective from the prior rally.
The path to that objective still runs through near-term checkpoints. The first is a clean reclaim of the 50-day EMA (~$0.2296). The second is acceptance above the mid-flag supply near $0.24–$0.25, followed by a break of the upper boundary just under $0.26. Clearing those levels with expanding volume would validate the continuation case and open the way toward the $0.45 measured target.
HBAR RSI climbs toward neutral as momentum steadies
The 14-day RSI for HBAR has risen from a late-September dip near the low-40s to ~45–46 today. That move shifts momentum from weak to neutral territory and places the indicator just below the 50 midline that separates bearish and bullish regimes. The RSI’s signal line sits slightly above price-RSI, showing a mild lag that often appears during early recoveries.
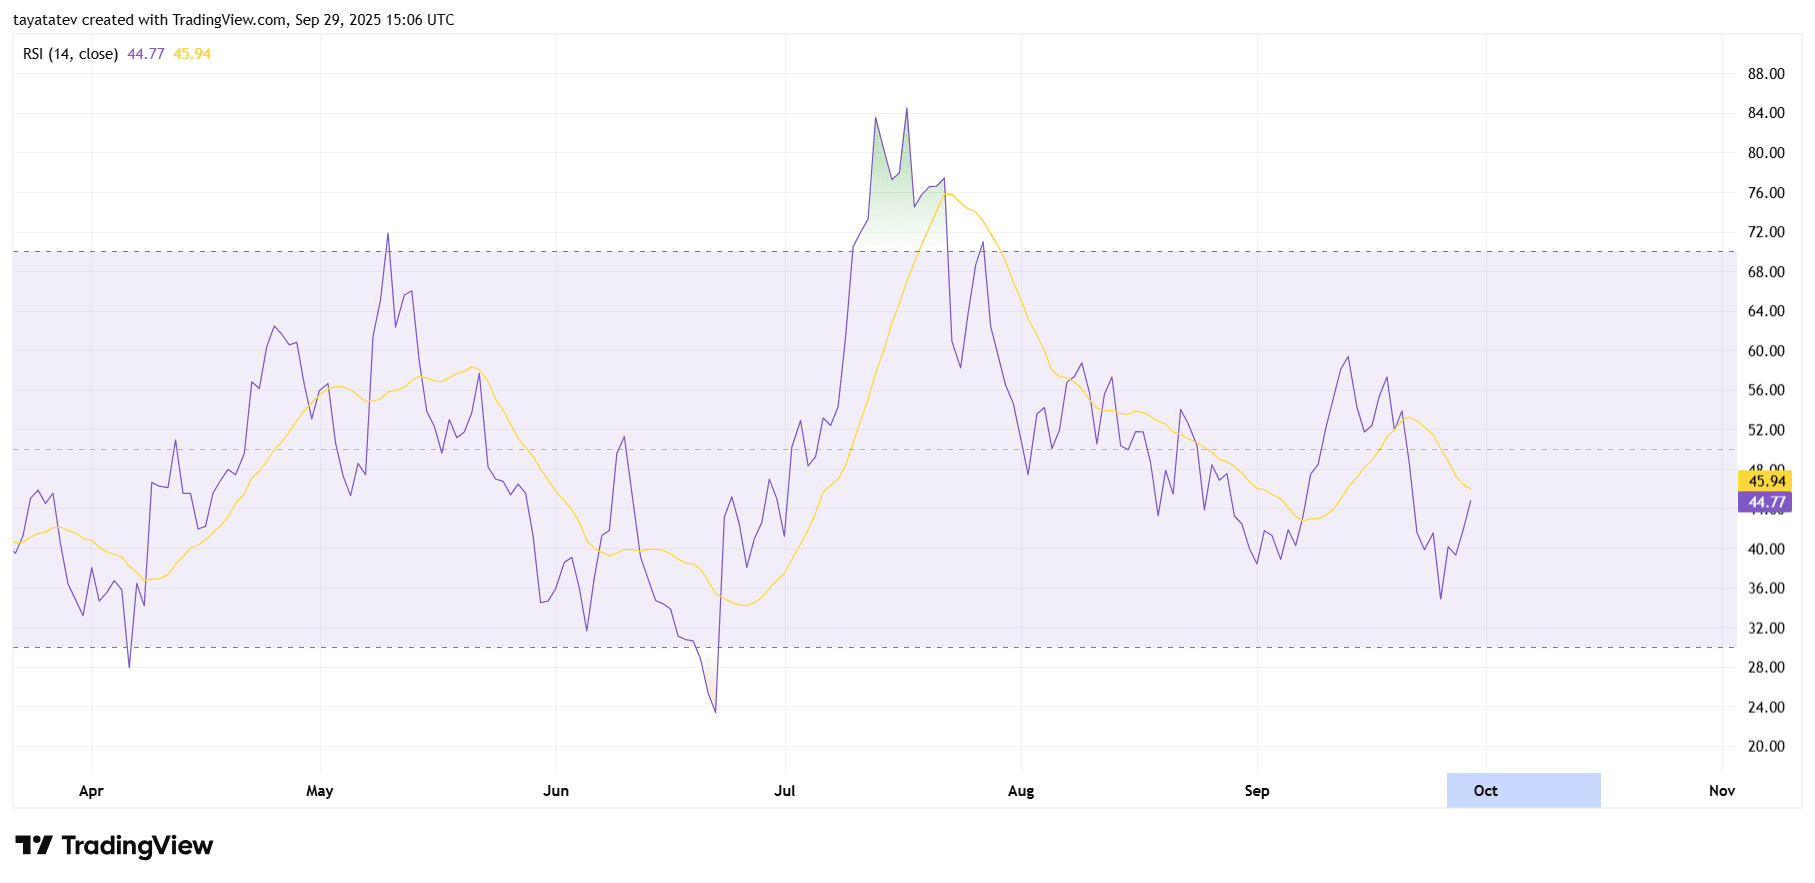
The chart also shows a higher RSI low while price recently tested the flag’s lower boundary. That creates a small bullish divergence, which suggests sellers lost pressure even as price probed support. Divergences do not guarantee a turn; however, they frequently precede tests of nearby resistance when they form near the lower band of a range.
Now the focus turns to the 50–55 RSI band. A clean push and hold above that zone would confirm improving momentum and typically aligns with attempts to break chart resistance. If the RSI instead rolls over under 45 and revisits 40, it would signal fading demand and keep HBAR inside a cautious, range-bound state.
How this fits the bullish flag view
Momentum is stabilizing as the price structure traces a falling channel consistent with a bullish flag. In flag patterns, RSI often compresses between 40 and 60 while price consolidates. A decisive RSI move through 50 usually arrives near the time price challenges the flag’s upper boundary, offering a secondary confirmation that buyers control the next leg.
Because RSI remains below 50, confirmation is not in place yet. However, the rising slope, the higher low, and the turn up in the RSI relative to its signal line support the idea that momentum is rebuilding. If that rebuilding continues and RSI holds above the midline on any pullback, the momentum backdrop would align with a breakout attempt from the flag.
If momentum weakens and the RSI closes below 40 again, the consolidation likely extends and forces another test of lower support. Therefore, watch the RSI reaction at 50 first, then 55, as those levels often mark the transition from neutral consolidation to sustained trend continuation.