
Hedera set a testnet upgrade window to v0.67 for Wednesday, Oct. 22, from 17:00 UTC, with an estimated 40-minute duration. The status notice advises that network services may see brief disruption while nodes update.
The incident log reiterates the same maintenance entry in October’s history. Together, the live banner and history view give the authoritativeschedule for developers staging releases or running automated test flows.
Therefore, teams that depend on public testnet endpoints should plan around that window. API calls, mirror queries, and transaction submissions could intermittently fail until the upgrade completes.
Mainnet v0.66: completed after a reschedule
Hedera moved mainnet to v0.66 in the Oct. 9 window after canceling an earlier Oct. 8 slot due to a technical issue. The status feed shows the cancelation, the re-post, and the completion update, which together form the definitive timeline.
This sequencing matters for auditors and operators who reconcile node behavior with ledger timestamps. Because the upgrade landed on Oct. 9, any observed RPC or consensus quirks on Oct. 8 relate to the canceled attempt, not a running migration.
Consequently, downstream services that pinned version gates to the first window should treat Oct. 9 as the effective changeover for mainnet v0.66.
Treasury report: current allocations and release methodology
Hedera’s Treasury Management Report provides the latest allocation tables and methodology, updated with data as of Oct. 3, 2025. The document outlines classification buckets, scheduled releases, and the governance process used by the Council’s Treasury Management and Token Economics Committee.
Community posts summarizing the update point to projected Q4 release figures and destination programs, but the canonical source remains the Hedera site. Readers should anchor any modeling to the official tables and notes in the live report rather than third-party summaries.
As teams plan runway or incentives tied to ecosystem programs, they can use the report’s cadence and categories to anticipate supply movements without referring to price. The report is structured for operational planning, not trading.
Q3 events and ecosystem activity carry into October
Hedera’s Q3 2025 events wrap, published three days ago, lists more than two dozen appearances across 18 cities and highlights developer-facing talks on integrating blockchains into business processes. The post frames the talks as ongoing into October, signaling sustained outreach.
In parallel, the September “Hedera Highlights” blog details ecosystem developments, including the Wyoming state stablecoin program’s selection of Hedera as its only new network in that cycle. The same post recaps pilots and collaborations that remain live this month.
Together, these updates show where Hedera is prioritizing time: developer education, tokenization, payments, and enterprise pilots. The emphasis stays on shipping and adoption rather than market action.
Policy and convenings this week
DC Fintech Week runs through Oct. 17 in Washington, D.C., with a policy-heavy agenda spanning regulators, academics, and industry. Hedera leadership has appeared at prior editions and adjacent briefings; this week’s program keeps the policy conversation active as technical upgrades roll out.
Public schedules and social posts from organizers underscore the event’s role in surfacing standards and risk topics relevant to public networks. These sessions often inform how ecosystem teams present compliance-ready designs.
Stakeholders tracking regulatory narratives can pair these convenings with Hedera’s technical change logs to align launch timing with policy windows, again without reference to price.
Hedera Weekly Chart Analysis: Descending Channel and Key Demand Zones
Hedera’s weekly HBAR/USDT chart shows a corrective structure unfolding inside a clear descending channel. Price has been moving steadily lower after its mid-cycle rally and is now approaching a previously tested demand zone. The current area between roughly $0.05 and $0.06 has historically triggered strong upside impulses, making it a critical zone to watch as the structure matures.
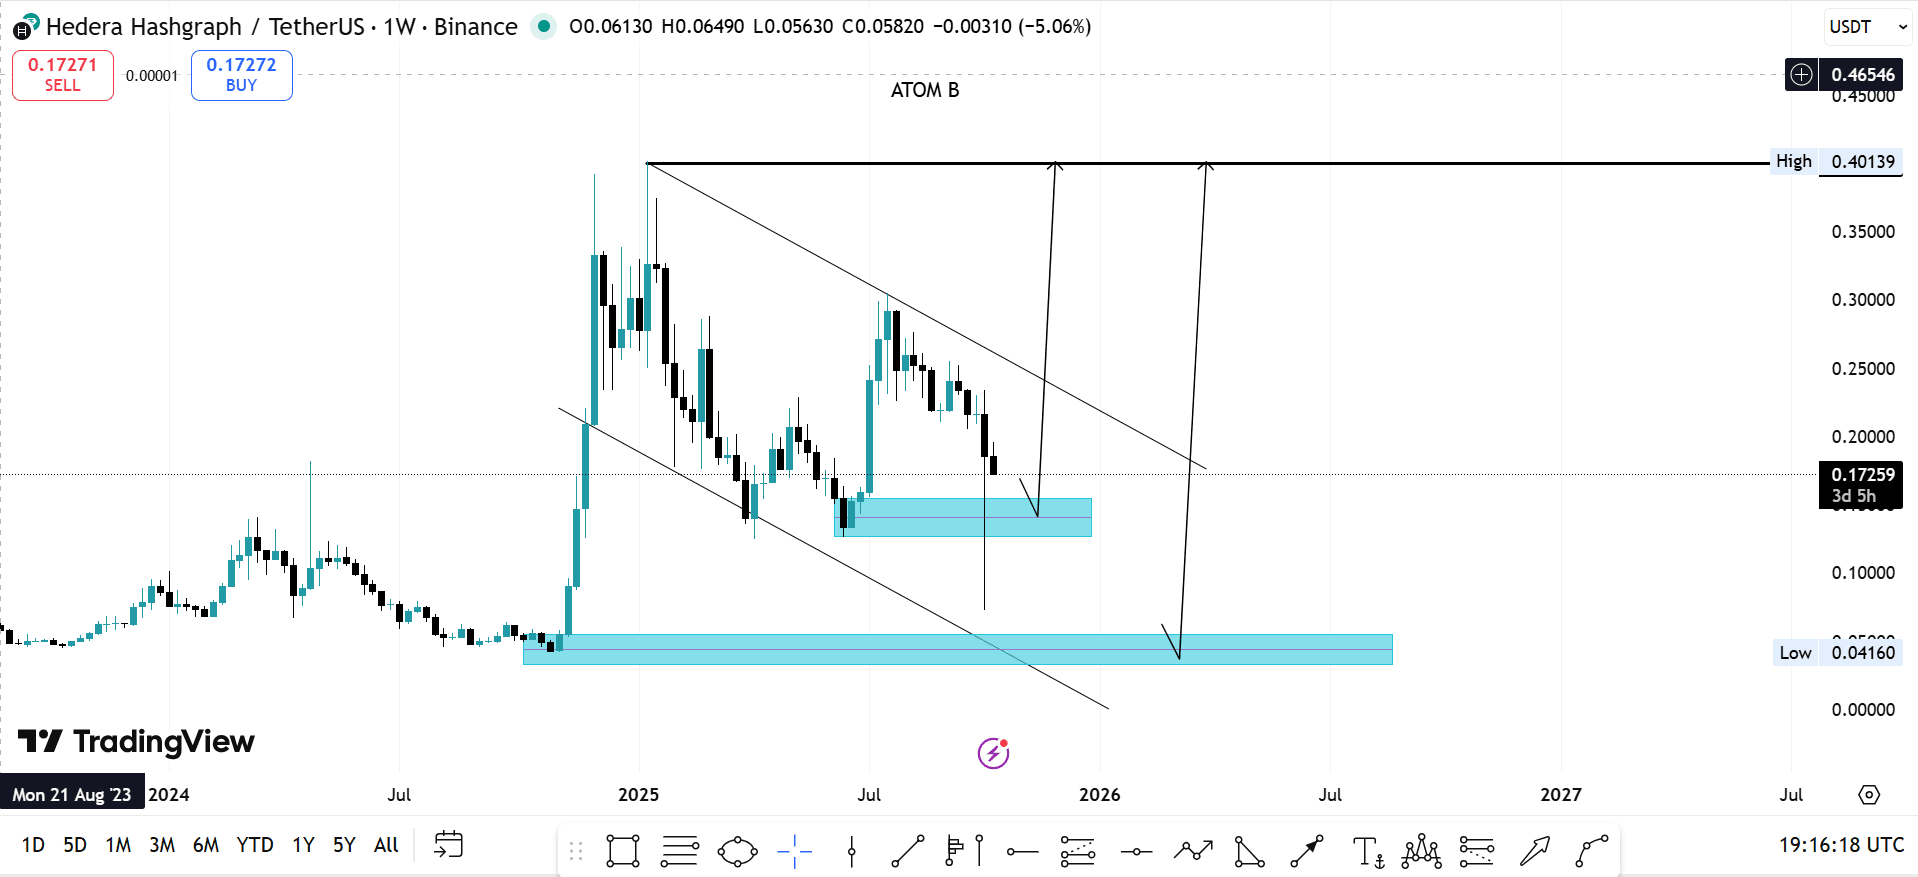
Price action shows that each major bullish leg in the past originated near this range. The pattern suggests traders have treated this area as a primary accumulation base. If buyers defend the zone again, momentum could shift back upward. The measured move from the channel projects a potential upside target near $0.46, aligning with prior reaction highs. A breakout above the descending channel would confirm a change in directional bias.
However, if price fails to hold this accumulation range, the next notable demand block sits around $0.04. This lower zone represents untapped liquidity and could be tested before any meaningful recovery takes place. The chart structure implies that patience and confirmation signals will be essential before the next major move establishes its direction.
Hedera Daily Chart Analysis: RSI Breakdown and MACD Compression
Hedera’s daily chart shows a clear downward structure inside a broad descending wedge. Price recently rejected from the mid-range trendline and is now trading within a marked box that spans roughly $0.12 to $0.18. This zone acts as a short-term decision area after the recent breakdown.
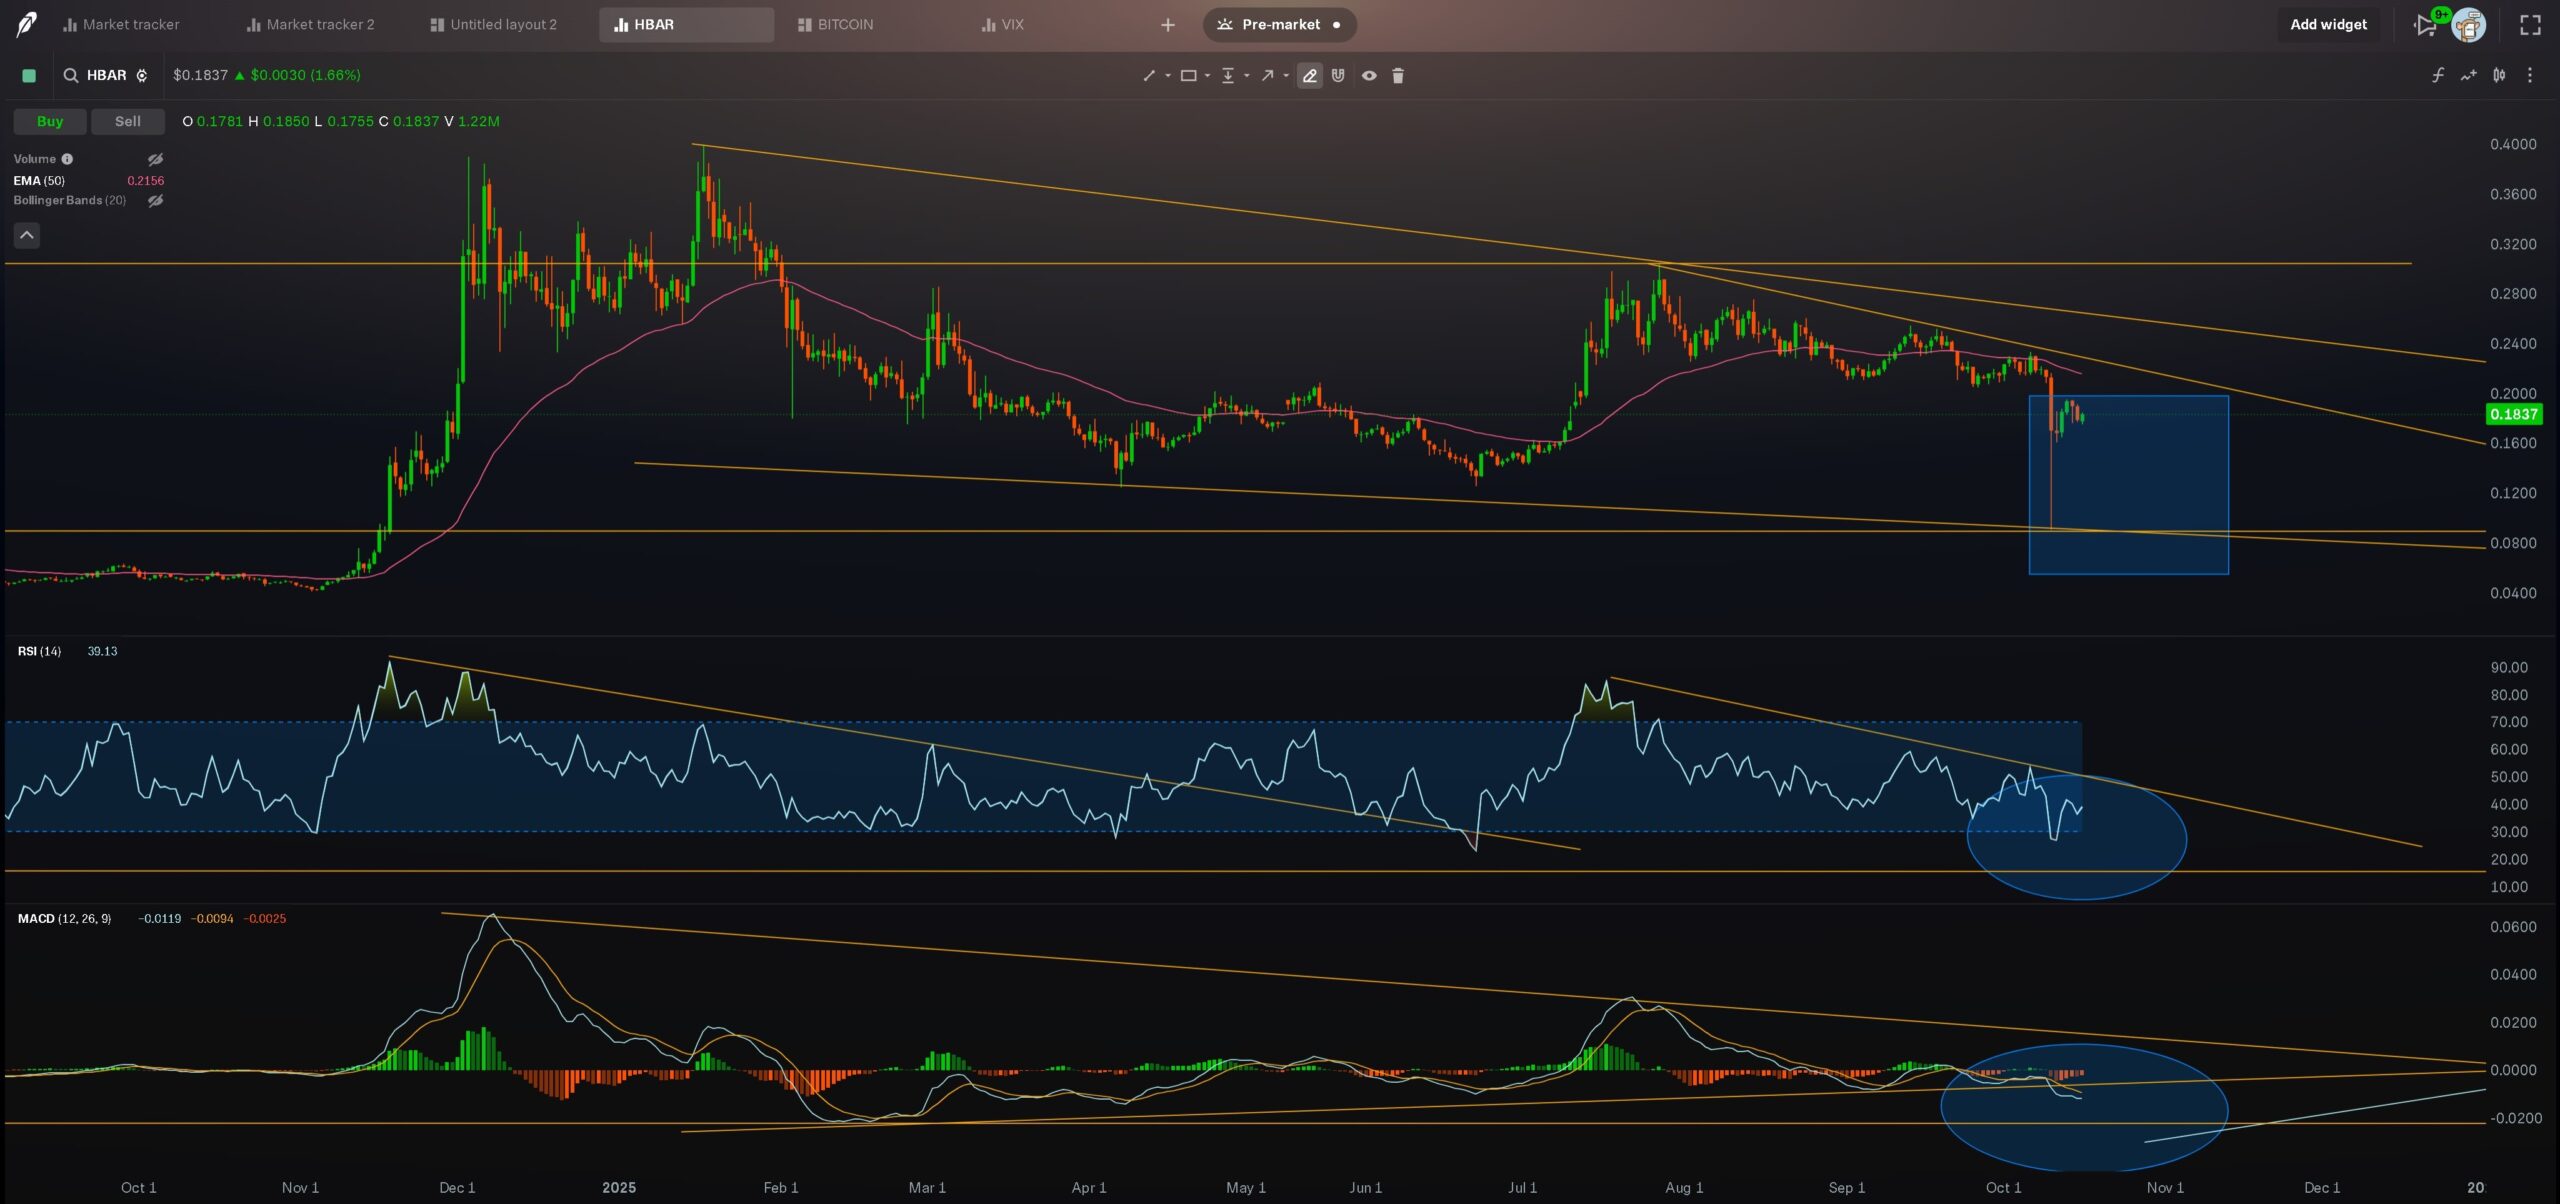
The 50-day EMA sits well above the current level, reinforcing the prevailing bearish structure. Price remains below both the moving average and the upper wedge boundary. This technical alignment suggests that momentum has not yet shifted in favor of bulls, and rallies toward the upper trendline may face resistance.
RSI and MACD Indicators Signal Ongoing Pressure
The daily RSI has broken down from a multi-month descending channel and now sits near oversold territory. The indicator has followed a consistent downward slope since mid-year, failing to reclaim its midline. The latest bounce remains weak, highlighting continued pressure.
MACD readings mirror this picture. The histogram shows muted momentum, while the MACD and signal lines remain compressed under the zero line. This alignment typically reflects indecision before a stronger directional push. The lower structure and lack of bullish divergence indicate sellers maintain control.
Key Levels and Structural Outlook
The chart identifies the $0.12–$0.18 box as a near-term inflection area. A breakdown below this zone could trigger a move toward the lower wedge boundary near $0.05, which coincides with a long-term support level that has historically attracted accumulation.
Conversely, if price manages to reclaim the 50-day EMA and break above the descending structure, it could signal a medium-term shift in momentum. Until that happens, the wedge structure and momentum indicators support a cautious outlook.