
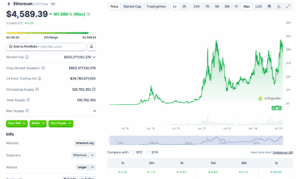
Ethereum (ETH) posted a daily and weekly gain of 1% and 11% respectively, trading near $4,578 on Oct. 6. The rally came after the U.S. government shutdown rattled markets and Grayscale activated staking for its Ethereum ETFs. Now, analysts are debating what comes next. Some see a strong breakout toward $7,500, while others warn of a possible pullback to $3,800. So, is Ethereum ready for another big run, or about to cool off? Let’s take a closer look.
Ethereum May Reach $7,500 By the End of Q4
Market analyst Cas Abbé (@cas_abbe) believes Ethereum’s chart looks ready for a major breakout. He points to a cup-and-handle formation, a pattern often seen before strong price rallies. In Abbé’s view, Ethereum has already finished the “handle” phase — a brief period of consolidation after recovery — and is now attempting to move higher.
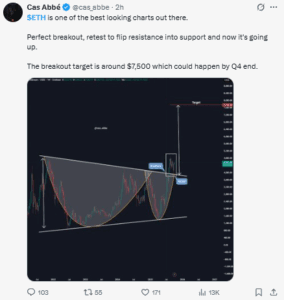
He explains that the breakout has already taken place, with ETH retesting the old resistance and turning it into new support. If this structure holds, Abbé says Ethereum could climb toward $7,500 by the end of the fourth quarter. The setup, he argues, shows strength rather than exhaustion — and the recent move above $4,500 might just be the start of a bigger rally.
Not everyone agrees with the bullish scenario. Analyst Ali (@ali_charts) warns that Ethereum might be running into resistance. He cites the TD Sequential indicator, which has printed a sell signal on the daily chart.
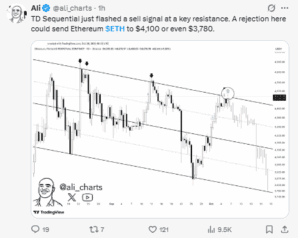
This indicator often appears when an asset’s upward momentum is stretched and could pause or reverse. According to Ali, if Ethereum gets rejected at current levels, it could drop toward $4,100 or even $3,780 before finding fresh support.
Ali’s analysis suggests that Ethereum’s strong rebound over the past few weeks might have gone too far, too fast. He indicated toward the short-term risk — that the market may need a healthy correction before attempting another leg higher.
Grayscale’s ETF Staking Launch Changes Market Dynamics
Abbé’s outlook aligns with broader optimism in the market following the approval of new staking ETFs. On Oct. 6, Grayscale Investments officially enabled staking for its Ethereum Trust (ETHE) and Ethereum Mini Trust (ETH) — making them the first U.S. spot crypto ETFs to offer staking rewards under the Securities Act of 1933. Together, these funds manage roughly $8.25 billion in assets.
Through staking, investors can earn annual rewards of about 3–5%, while their ETH remains locked to help validate transactions on the network. This could make Ethereum more attractive to institutional investors, who can now gain both price exposure and yield through regulated ETFs.
However, it’s not a perfect setup. According to filings, part of the staking rewards will go to custodians, staking providers, and Grayscale itself — reducing the net yield that reaches investors. Still, analysts see this as a turning point that could tighten Ethereum’s liquid supply and increase demand from yield-focused funds.
On-Chain Data Shows Long-Term Accumulation
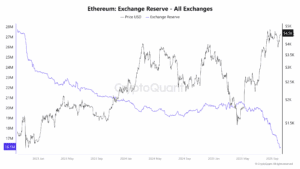
Data from CryptoQuant shows that the total amount of Ethereum held on exchanges has dropped to 16.1 million ETH — the lowest in more than two years. That’s a positive sign, as fewer coins on exchanges usually mean fewer are available for immediate sale.
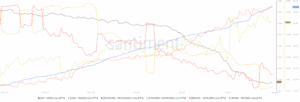
Additional data from Santiment indicates that large holders — wallets holding 10,000 ETH or more — have been steadily increasing their balances since midyear. Meanwhile, smaller wallets have been reducing their holdings. This pattern suggests that larger, long-term investors are positioning themselves for what they believe could be another major rally.
Even though there have been spikes in realized profit-taking — short periods when traders locked in gains — overall on-chain data points to accumulation rather than distribution.
On the daily chart, Ethereum price remains above all major moving averages, showing that the broader trend is still upward. The Relative Strength Index (RSI) stands near 60, suggesting room for more upside without being overbought.
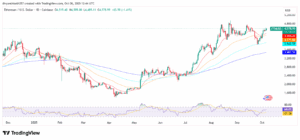
If ETH can close decisively above $4,800, it could confirm a breakout and open the path toward $5,500 and possibly $7,000–$7,500 later this year. But if the ETH price fails to hold above $4,100, the risk of a short-term correction toward $3,800 increases, as Ali has warned.