
Large weekly wicks have repeatedly marked turning points on Hedera’s chart. In 2020, a long downside wick coincided with capitulation and a subsequent rebound that the chart annotates as roughly +3,170%. Later, extended upside wicks preceded major drawdowns, with the labeled tops followed by declines near 78%, 93%, and 77%. The pattern shows how aggressive moves outside the weekly body often signal exhaustion rather than continuation.
Today, the chart highlights another pronounced downside wick while price sits near $0.19. That wick stretches into the mid-$0.10s on the scale, indicating heavy intraday or intraweek selling that buyers later retraced. Historically, such lower wicks on this asset appeared close to cyclical lows, while upper wicks clustered near distribution zones at peaks. Therefore, the present candle structure suggests a bottoming attempt rather than confirmed reversal.
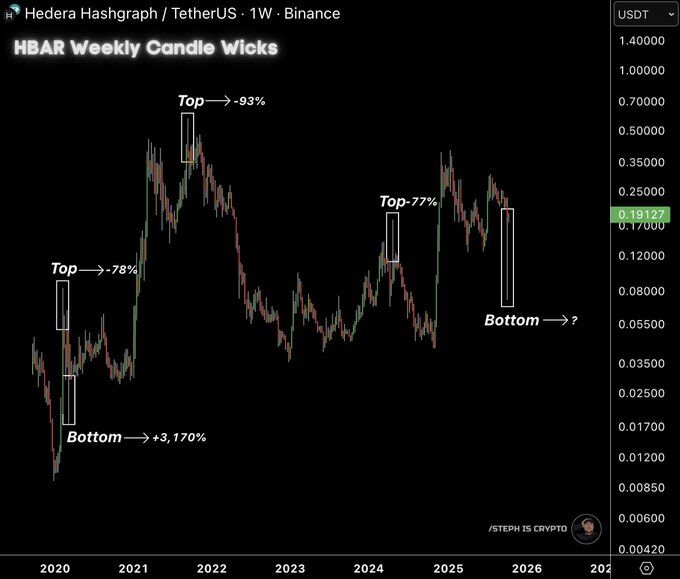
However, context matters. Previous bottom wicks formed after multi-month declines and then built bases before trending higher. Similarly, current structure would still need follow-through: smaller bodies, rising closes, and support holding on retests. If the market loses the wick’s lower area—roughly the $0.09–$0.12 zone suggested by the highlighted box—the signal weakens and the market risks another leg down. Conversely, if buyers defend that zone and weekly closes start stepping up, the wick can evolve into a durable pivot.
Finally, the recurring wick behavior underscores sentiment swings. Long lower wicks reflect forced selling and value buying into illiquid pockets. Long upper wicks reflect profit-taking and fading momentum near resistance. The present setup mirrors the former. Yet, as past cycles show, it is the weeks after the wick—structure, volume, and higher lows—that confirm whether a tradable bottom has formed.
HBAR hits downtrend cap; moving averages roll over
Price sits beneath a year-long descending channel and just tagged the upper trendline, where it rejected again. The 50-day MA (green) has curled down through the 200-day MA (red) at prior failure zones, echoing the circled areas from spring and late summer. Momentum stays weak: RSI hovers near the lower band, which usually favors sellers until it stabilizes with higher lows.
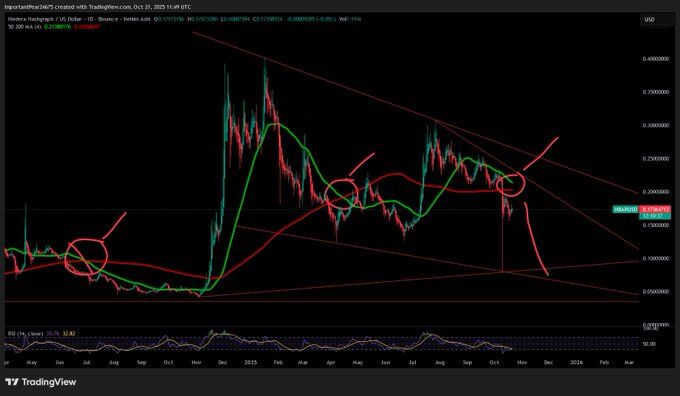
From here, the path of least resistance remains down while HBAR trades below both MAs and the descending trendline. If sellers keep control, price can drift toward mid-channel supports first, then the lower boundary drawn from the 2024 base. Long lower wicks near those lines would signal capitulation attempts, but without follow-through the trend stays intact.
However, a clean reclaim would change the tape. A weekly close back above the 50- and 200-day MAs, followed by a retest that holds, would convert resistance to support and open room toward the channel’s upper rail. Until that sequence appears, the chart reads as a series of lower highs inside a controlled downtrend, with rallies sold at the moving-average cluster and the diagonal cap.