
Zebec Network has partnered with US banking firm Kotapay to bring blockchain-based payroll to American companies, a move that could reshape how employees get paid. The announcement also aligns with a bullish setup on the ZBCN chart, where analysts see potential for a 750% breakout. But can it really happen? Let’s find out.
Regulation Clears the Path for Blockchain Payroll
Zebec Network announced its partnership with Kotapay, a payments division of First International Bank & Trust (FIBT), to connect blockchain payroll with traditional US banking systems. Kotapay manages billions of dollars in payroll transfers each year and provides direct deposit, tax payment, and vendor transfer services to businesses across all 50 states.

The integration allows Zebec to process salaries using both US dollars and stablecoins, giving companies the flexibility to combine traditional and digital payments under one compliant framework. By using Kotapay’s established ACH and wire networks, Zebec can deliver real-time and regulated payroll transactions directly into employees’ accounts.
Zebec CEO Simon Babakhani said the partnership follows new regulatory clarity under the Genius Act, a US law passed earlier this year that formally recognizes stablecoins as legal tender when issued by licensed banks and backed by reserves.
Under the new framework, banks can legally issue and handle stablecoins, enabling collaborations between traditional payment institutions and blockchain firms. Zebec said the Kotapay integration will reduce payment delays, improve compliance, and make stablecoin payroll practical for mainstream businesses.
Analyst Points to Bullish Setup on ZBCN Chart
Market analyst MoonGod shared a technical assessment of Zebec’s token, ZBCN, identifying a double-bottom or “W” pattern on the daily chart — a structure often associated with potential bullish reversals. The setup has been developing since late August, with two distinct lows appearing around $0.0037 and $0.0038.
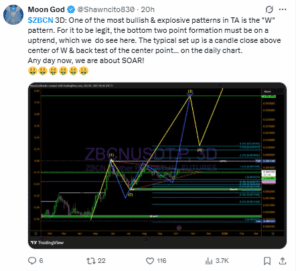
The pattern’s midpoint, or neckline, lies near $0.0048, and analysts said a confirmed daily close above this zone would complete the formation and could lead to a move toward the next resistance range between $0.0058 and $0.0060.
Technical indicators also show that ZBCN is trading above its 20-day and 50-day exponential moving averages (EMAs), both of which are sloping upward — a sign of sustained short-term strength. However, trading volume has not yet reached the level typically seen during confirmed breakouts, suggesting that confirmation remains pending.
Analysts added that a daily close above $0.0049–$0.0050 would be required to validate the bullish setup. Until then, ZBCN is likely to consolidate between $0.0042 and $0.0049, with downside support near $0.0040.
Technical Outlook Confirms Setup but Not Breakout
An independent analysis of the ZBCN to USD chart confirms that the bullish setup identified by analysts is technically valid but not yet complete. ZBCN traded near $0.00451, down 2.4% on the day, holding above its short-term EMAs. The broader trend remains constructive, with the 100-day ($0.00406) and 200-day ($0.00350) averages trending higher.
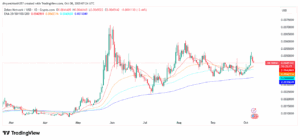
The RSI sits around 54.8, which means momentum is mild—neither overheated nor weak. Past rallies in ZBCN have started once RSI pushed above 60, so the next few days could be decisive.
A close above $0.0049–$0.0050 would confirm the breakout and potentially target the $0.0058–$0.0060 zone. Falling below $0.0040, however, would negate the pattern and return the token to a consolidation phase.