
KuCoin activated zero-fee USDC withdrawals on the XDC Network today, opening a limited promotion for users. The offer applies to the first 20,000 USDC withdrawals processed via XDC.
The campaign began on October 28 at 08:00 UTC and runs through November 27 at 08:00 UTC. During this window, users can move USDC over the XDC rail without paying KuCoin’s withdrawal fee.
The exchange positioned the move as a way to lower off-ramp friction and expand stablecoin access on XDC. As the quota fills, KuCoin will continue regular operations, but withdrawals after the cap or beyond the end date will incur standard fees.
XDC Prints Bullish Flag on Daily Chart — Oct 29, 2025
XDC traded near $0.06156 on October 29, 2025, while its daily chart formed a bullish flag. After a sharp advance in July, price has consolidated inside a downward-sloping, parallel channel. In simple terms, a bullish flag is a pause after a strong rally; if buyers break the upper rail with a decisive daily close, the trend often resumes higher.
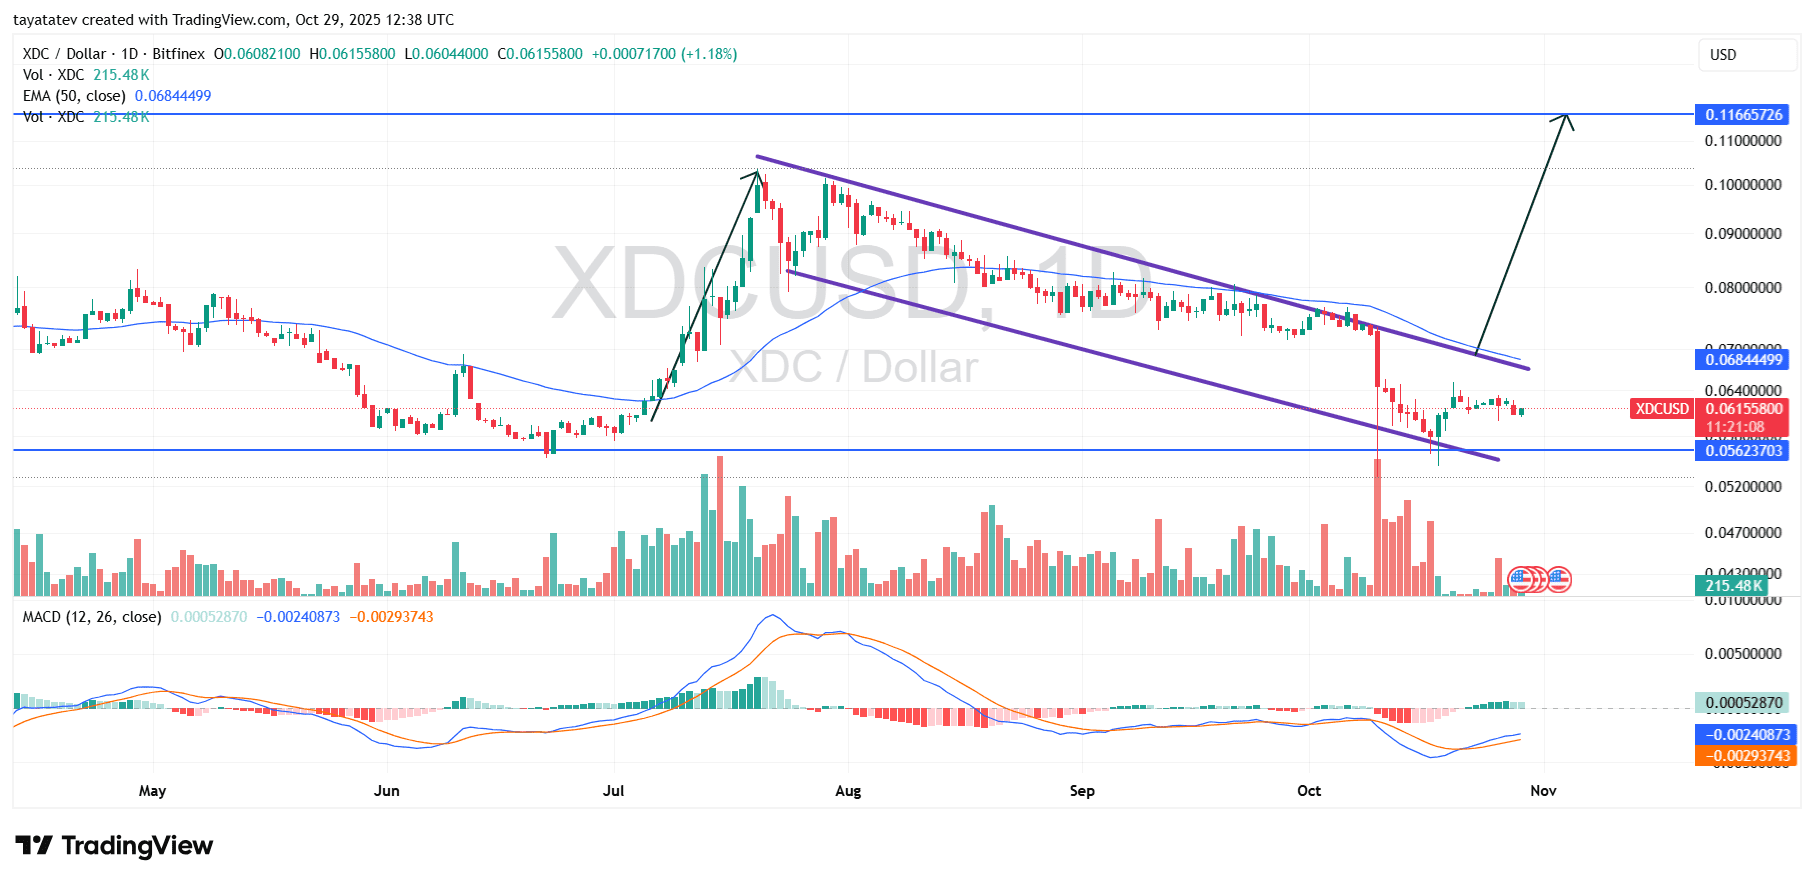
Price now sits below the 50-day EMA (~$0.06845) and tracks the flag’s upper boundary. A daily close above the upper trendline and the 50-EMA would confirm the pattern. If that confirmation arrives, the measured move points about 88% higher from today’s level, targeting ~$0.1157. This target aligns with the prior impulse size, which flags typically extend after consolidation.
The chart shows support around ~$0.0562, where buyers defended the lower rail on recent dips. Meanwhile, the 50-EMA near ~$0.0685 overlaps the flag’s ceiling, creating a clear trigger zone: a strong daily close above it would validate momentum. In addition, MACD is curling upward and the histogram has improved, which signals recovering momentum but still requires price confirmation.
Until a breakout print appears, the flag remains unconfirmed and range conditions can persist. A daily close back below ~$0.0562 would weaken the structure and delay the bullish scenario. Conversely, a clean push and hold above the upper rail would unlock the ~$0.1157 objective implied by the measured move.
RSI Shows Recovering Momentum — Oct 29, 2025
XDC/USDT daily RSI (14) prints ~39.35 today while its signal average sits near 35.18. The RSI has rebounded from early-October oversold readings and now holds in the 30–40 zone. Moreover, the RSI line trades above its signal average, which signals short-term momentum repair even as conditions remain below the neutral 50 mark.
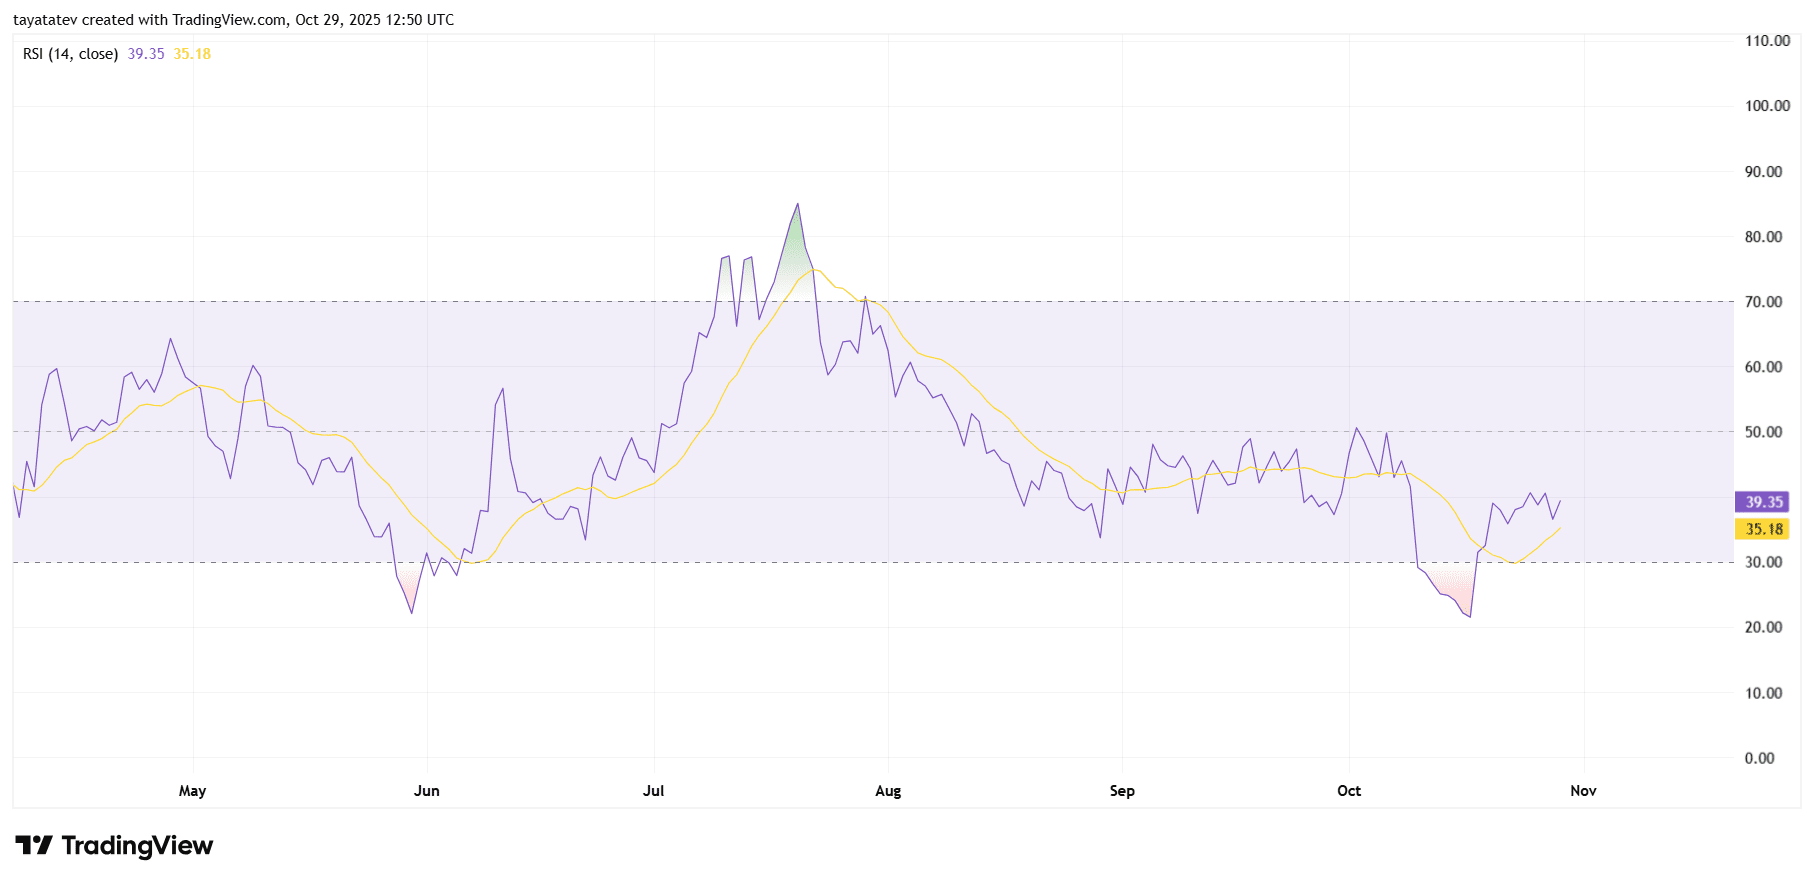
After the selloff, RSI carved a higher low and pushed back inside the channel’s midrange. This shift often precedes stabilization as sellers lose control. If the RSI closes and holds above 50, momentum would align with a bullish-flag breakout on price and strengthen the case for continuation.
However, risks remain. If RSI rolls back under 30, bearish pressure would return and challenge support around recent price lows. Until RSI clears 50–55, rallies can fade at resistance. Therefore, watch for RSI to keep making higher lows while price defends support; that sequence would confirm improving momentum behind the chart’s bullish setup.