
The price of Litecoin (LTC) rallied to $114 on Sept. 16, after dropping over 6% since Sept. 14. The move came after a steady climb earlier in the month, during which LTC held firm despite broader market volatility.
Market participants likely capitalized on the token’s rising ETF hype, watching the dip closely, weighing whether momentum would continue into the week. At the same time, focus shifted to the looming decision on Canary Capital’s proposed spot Litecoin ETF. The deadline in early Oct. 2025 sparked speculation across trading desks, feeding optimism that approval could lift sentiment around LTC.

ETF Deadline Becomes a Market Cue
Speculation around Canary Capital’s spot Litecoin ETF intensified as the SEC’s Oct. 2025 deadline approached. The filing proposed a 0.95% annual fee, placing it higher than most equity ETFs but in line with early-stage crypto funds.
Investors weighed the cost against the possibility of a regulated avenue to gain exposure to LTC. The structure promised to track Litecoin’s spot price, with custody handled through approved providers, but regulators made the final decision.
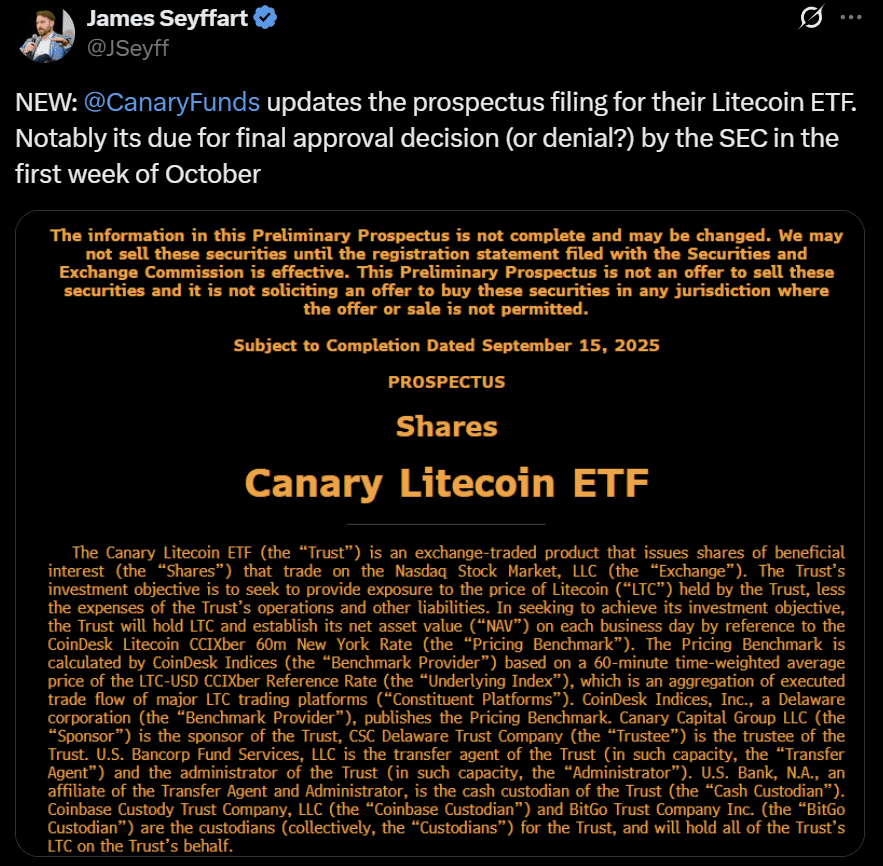
Bloomberg ETF analyst James Seyffart highlighted the updated prospectus on Sept. 15, noting that the SEC’s final decision window fell in the first week of Oct. 2025. Seyffart’s comments underscored how close the approval process had moved, reinforcing that the ruling would be pivotal for Litecoin’s immediate trajectory. Markets responded quickly to the approaching deadline.
The risk, however, remained tied to the SEC’s track record with altcoin ETFs. Multiple deferrals over the year underlined the uncertainty, and a rejection would almost certainly dampen short-term momentum.
Yet the market’s tone leaned optimistic, with the ETF seen as a validation event for Litecoin. The correction earlier in September showed how sensitive price action remained, but the renewed climb hinted that traders were willing to bet on a positive outcome. The technical recovery and Seyffart’s flagged deadline kept Litecoin at the center of ETF speculation.
LTC Price Finds Support in Technicals and Utility
The ETF deadline was not the only factor shaping sentiment. Market voices pointed to Litecoin’s structure as evidence that price momentum could extend.
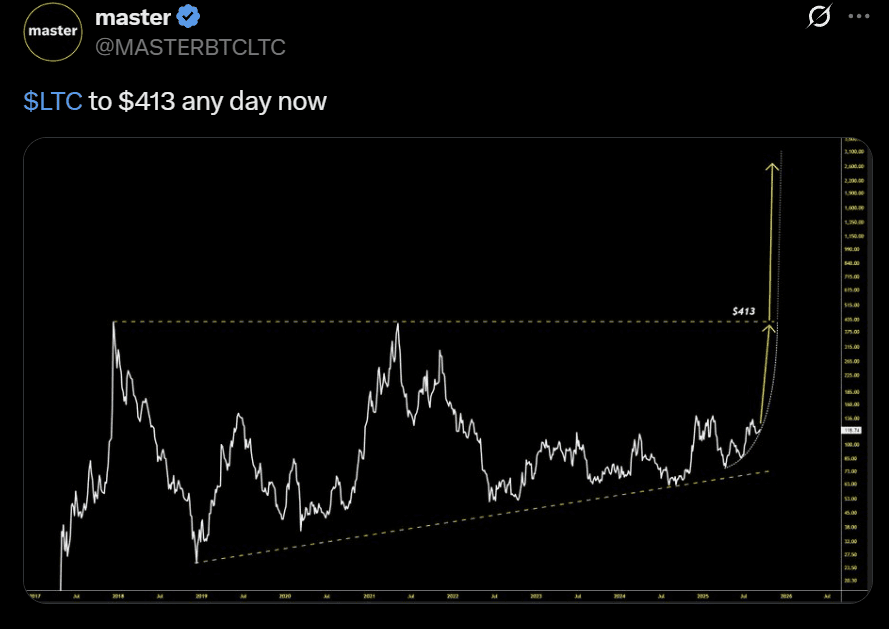
X-based independent analyst Master projected a breakout toward $413, citing the coin’s long-term consolidation and the potential for a parabolic move. The call resonated in trading circles, framing Litecoin as one of the few majors with a defined technical path higher.
At the same time, utility data reinforced the bullish undertone. Figures from the Litecoin Foundation showed LTC remained the most used cryptocurrency for payments on BitPay in August, accounting for 30.99% of transactions.
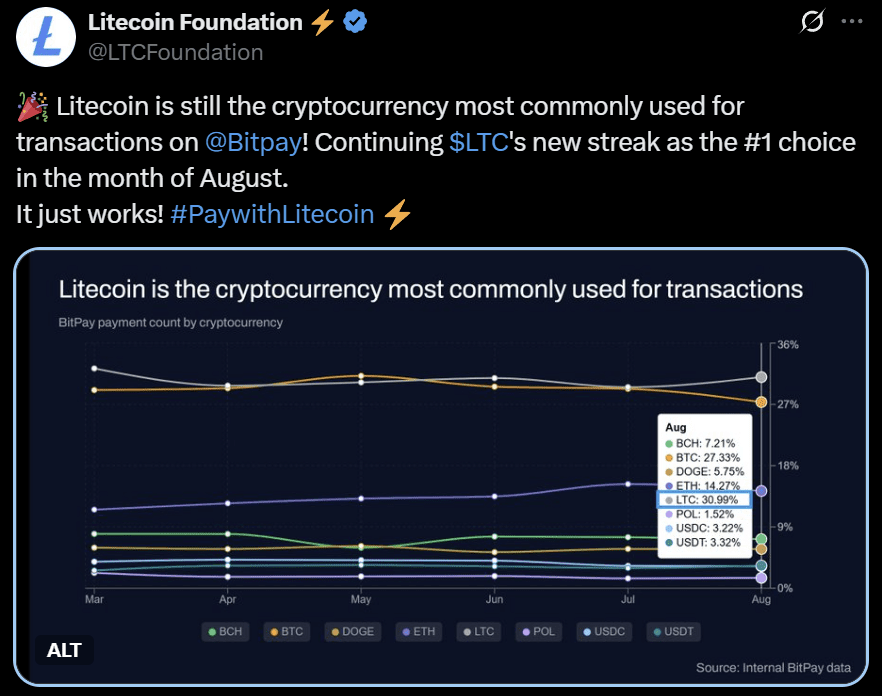
The dominance underscored Litecoin’s foothold in everyday usage, lending weight to the narrative that an ETF approval could unlock further adoption. The combination of technical targets and transaction strength supported the optimism already building around October’s decision window.
LTC Forms a Falling Wedge With a Possible Target Near $135
Meanwhile, the LTC USD pair showed chances of a bullish breakout after the recent weekly consolidation. LTC price formed a clear falling wedge, with two contracting trendlines and declining volume into the apex. Falling wedges typically resolve as reversal patterns when buyers push the price above the upper trendline.
The accepted target calculation measured the wedge’s maximum height and projected that distance from the breakout level. If the Litecoin price confirms its breakout from the wedge pattern, the token has a theoretical price target near $135.
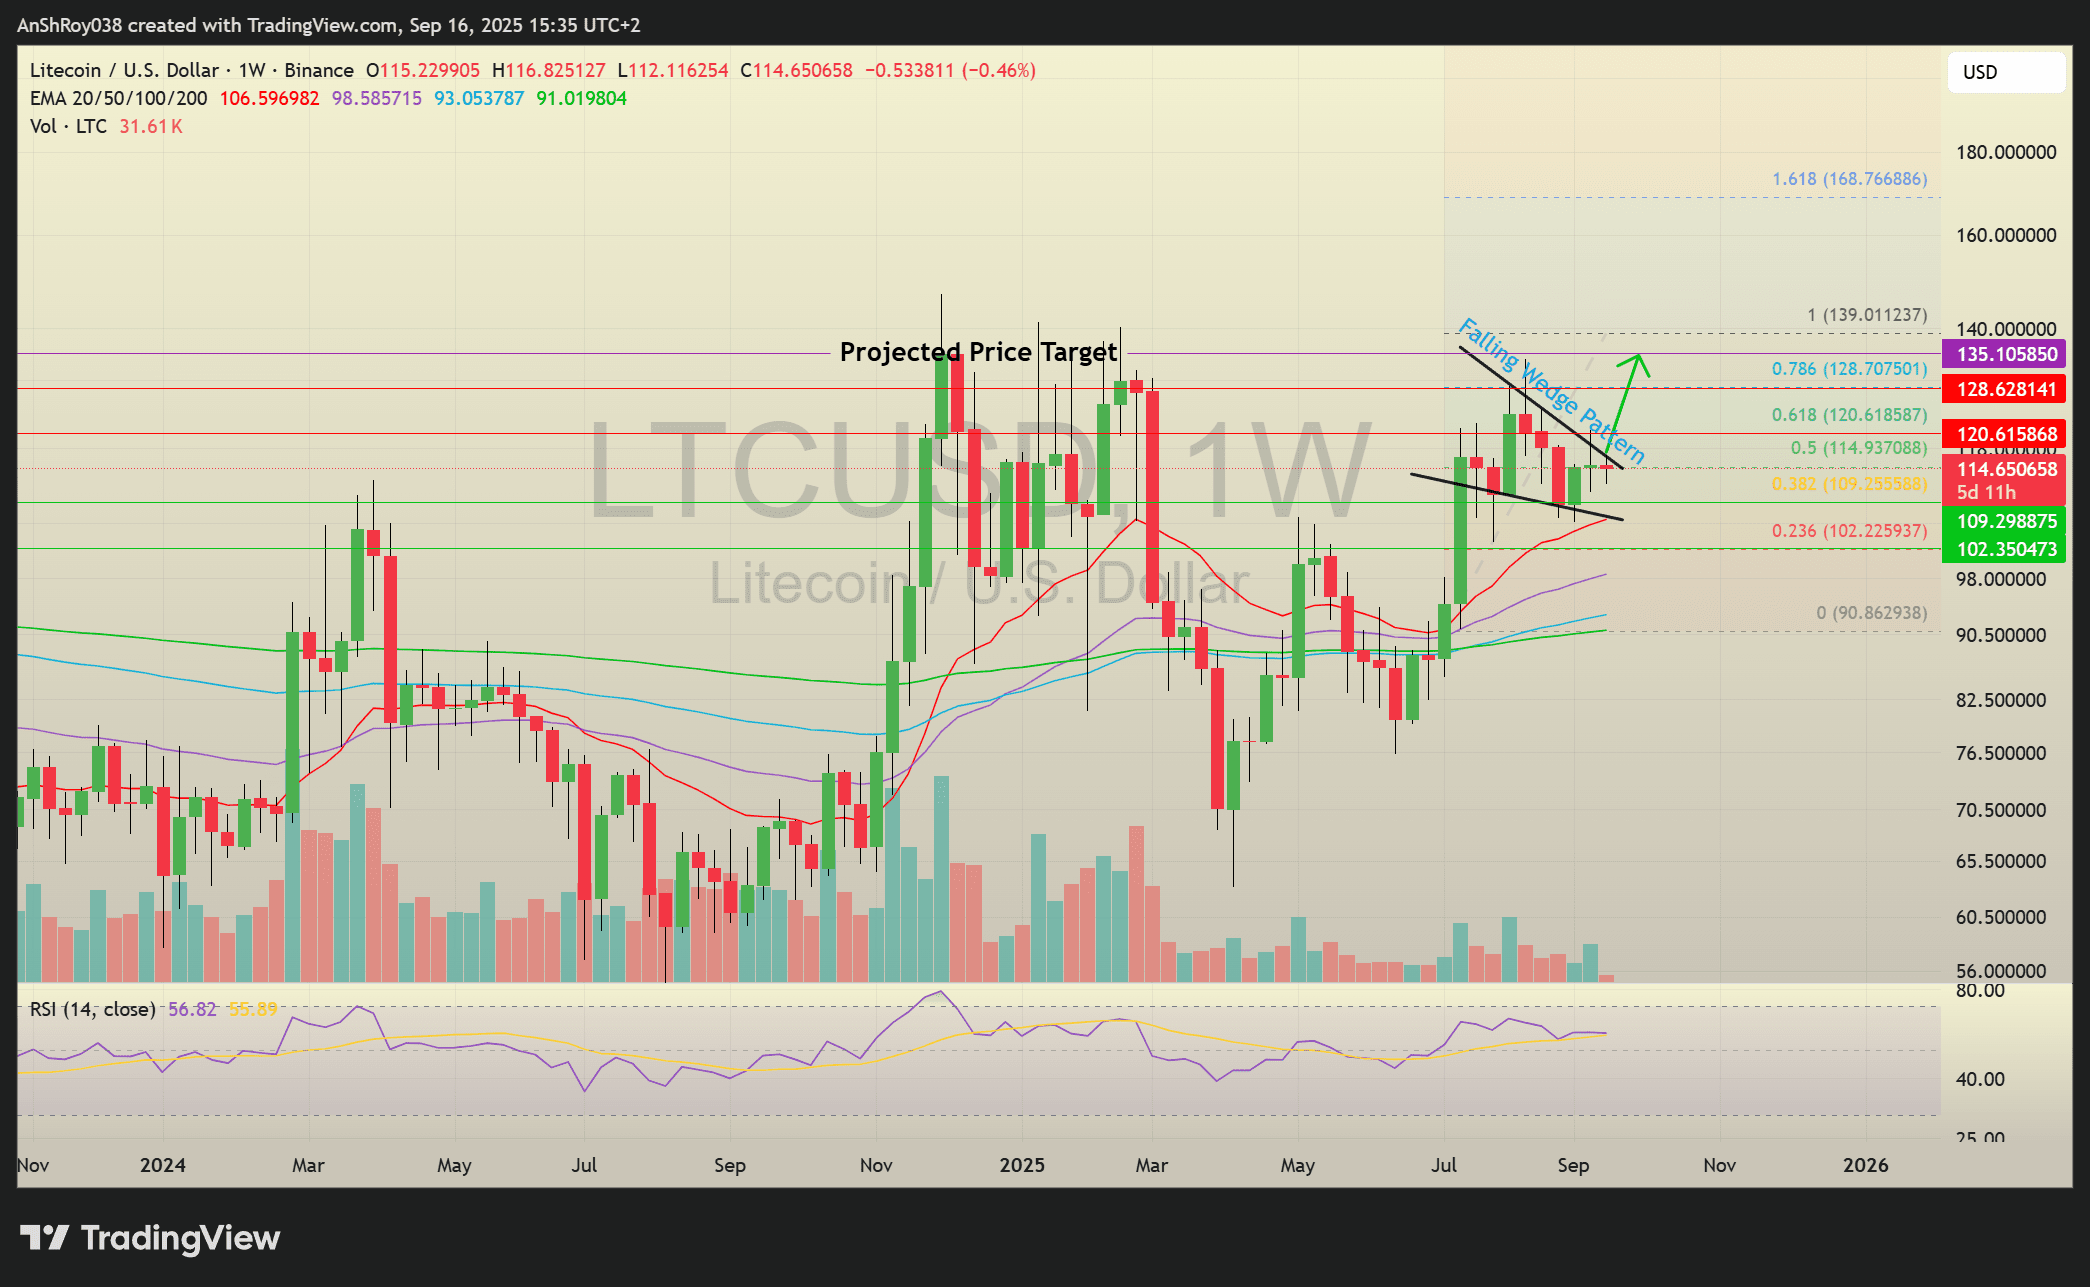
If the uptrend continues, LTC price has immediate resistance near $120.62. Flipping the immediate resistance would target the resistance near $128.63.
Conversely, a downtrend could push LTC price to the support near $109.3. Breaching the immediate support could force the token to test the support near $102 before recovering.
Volume behavior and the weekly RSI suggested momentum had room to follow a confirmed breakout. The ETF decision window amplified the move by concentrating flows and positioning. If LTC price cleared the upper trendline with conviction, the measured-target method implied a credible path toward the highlighted resistances. Conversely, a failed breakout would have left the wedge intact and negated that upside narrative.