
Litecoin (LTC) price recovered to near $97 on Oct. 13 after the token crashed by over 81% over the weekend, briefly dipping to multimonth lows near $54 before buyers stepped in.
Despite the volatility, onchain and technical signals suggested structural resilience. Analysts pointed to historical patterns and Elliott Wave formations, hinting that Litecoin’s long-term setup remained bullish despite near-term uncertainty. Let’s dwell.
Analysts See Litecoin Near Breakout Phase
Litecoin’s rebound reignited debate among analysts tracking its long-term structure.
Independent analyst The Penguin reaffirmed his bullish thesis, noting that Litecoin’s Elliott Wave formation appeared close to completion.
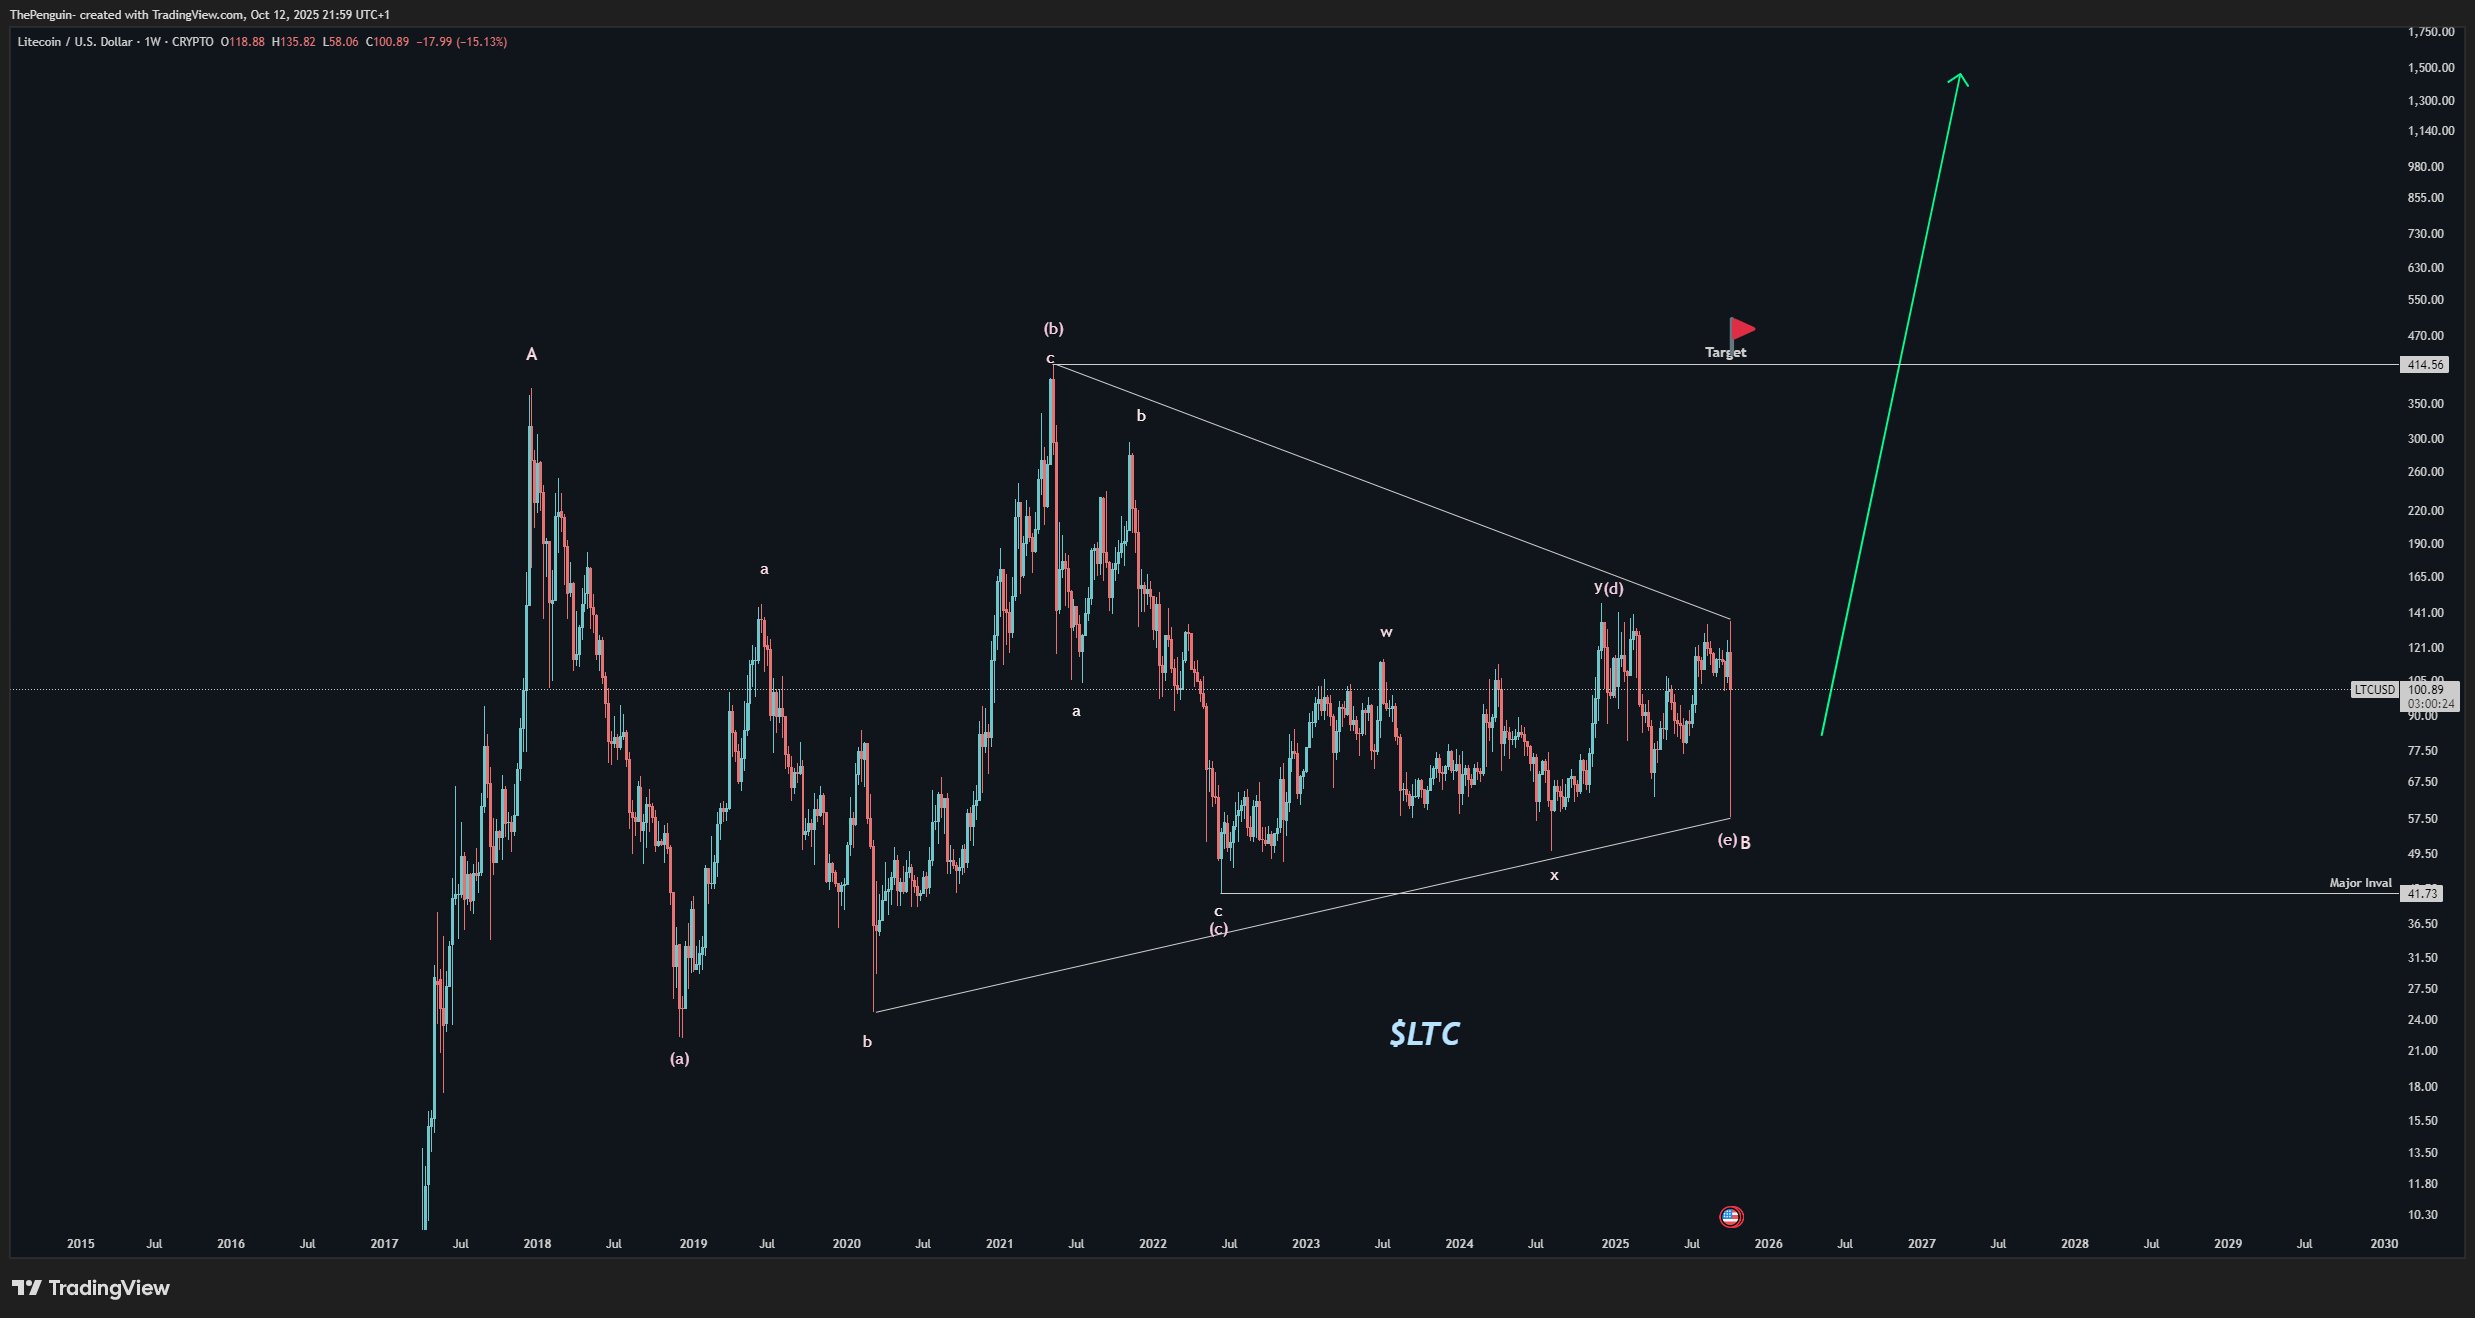
The analyst described the ongoing move as the E-wave, often seen before large expansions. The Penguin’s chart projected an overthrow pattern — a structure where price briefly breaks below support before explosive recovery. Moreover, the trader identified $41.73 as a major invalidation zone and accumulated spot positions during the dip.
Pinnacle_Crypto pointed to historical consistency within Litecoin’s long-term ascending channel. Pinnacle’s chart showed repeated bullish reversals every October since 2022, often following similar pullbacks to the lower boundary near $90–$100.
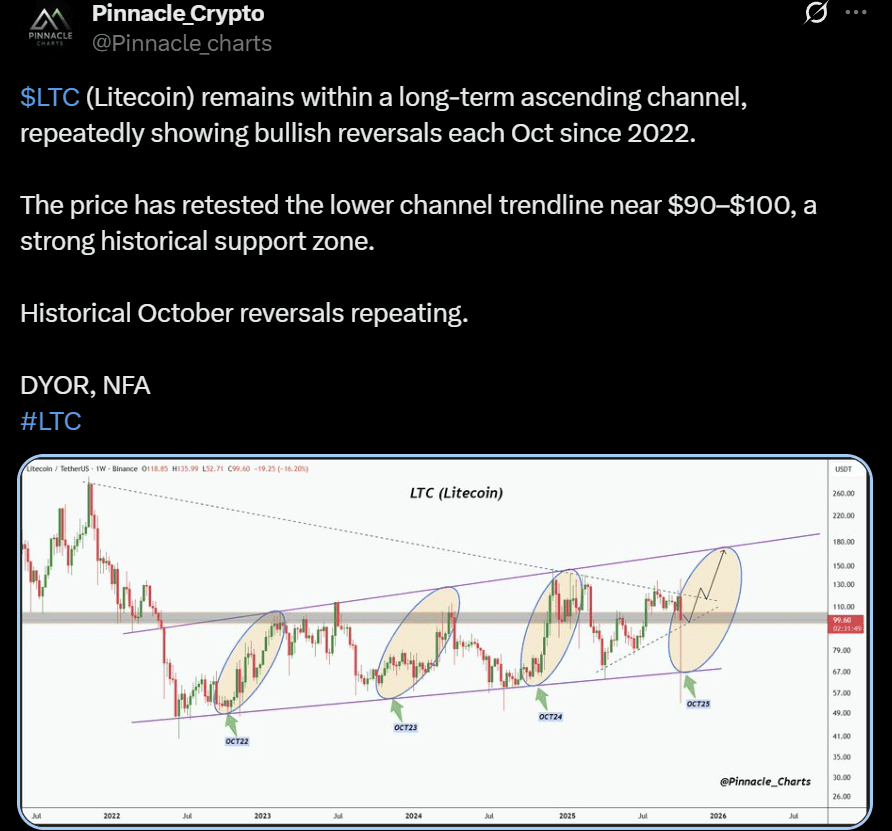
The analyst described the area as a historically proven demand zone, where previous recoveries triggered multi-month rallies. The pattern suggested that Litecoin’s current retest could mark another cyclical bottom, reinforcing the token’s seasonal rhythm.
Furthermore, Minimilian took a historical approach, comparing the latest drop to Litecoin’s 2017 price flush. The analyst noted that the earlier move preceded a vertical rally as market conditions flipped rapidly after a steep sell-off.
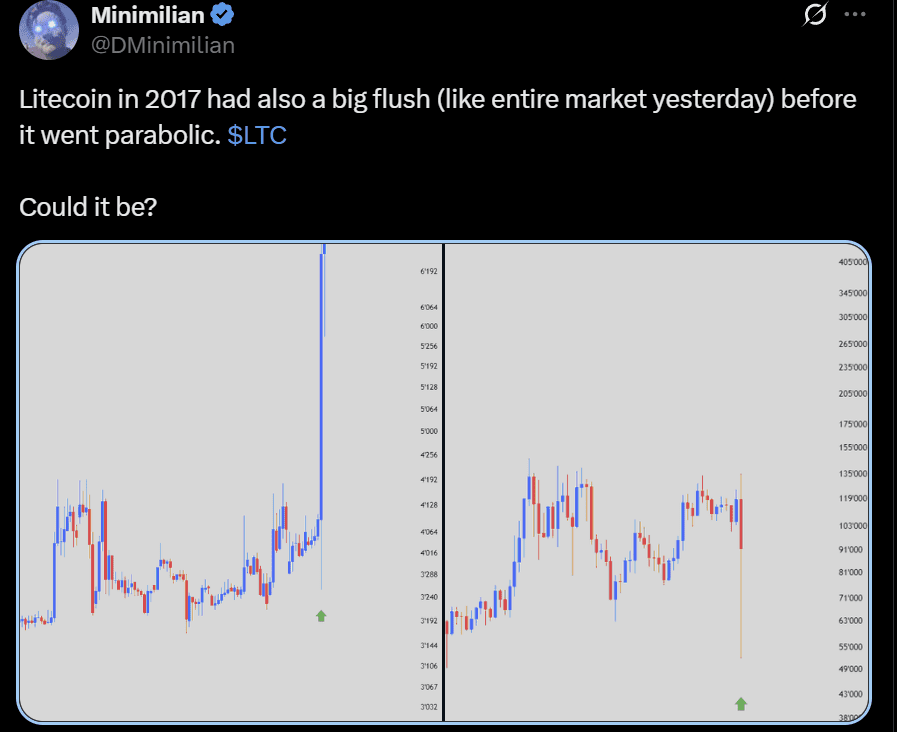
The analogy implied that Litecoin’s sharp intraday drop might represent a capitulation event before a new parabolic phase. His tone leaned on pattern repetition rather than structural confirmation, echoing optimism across technical circles.
Meanwhile, TradingView-based analyst Traders_Notes emphasized accumulation near the same zone. The analyst described current price action as part of a broad ascending channel, highlighting a potential liquidity trap below $90 that could trigger weak hands before continuation.
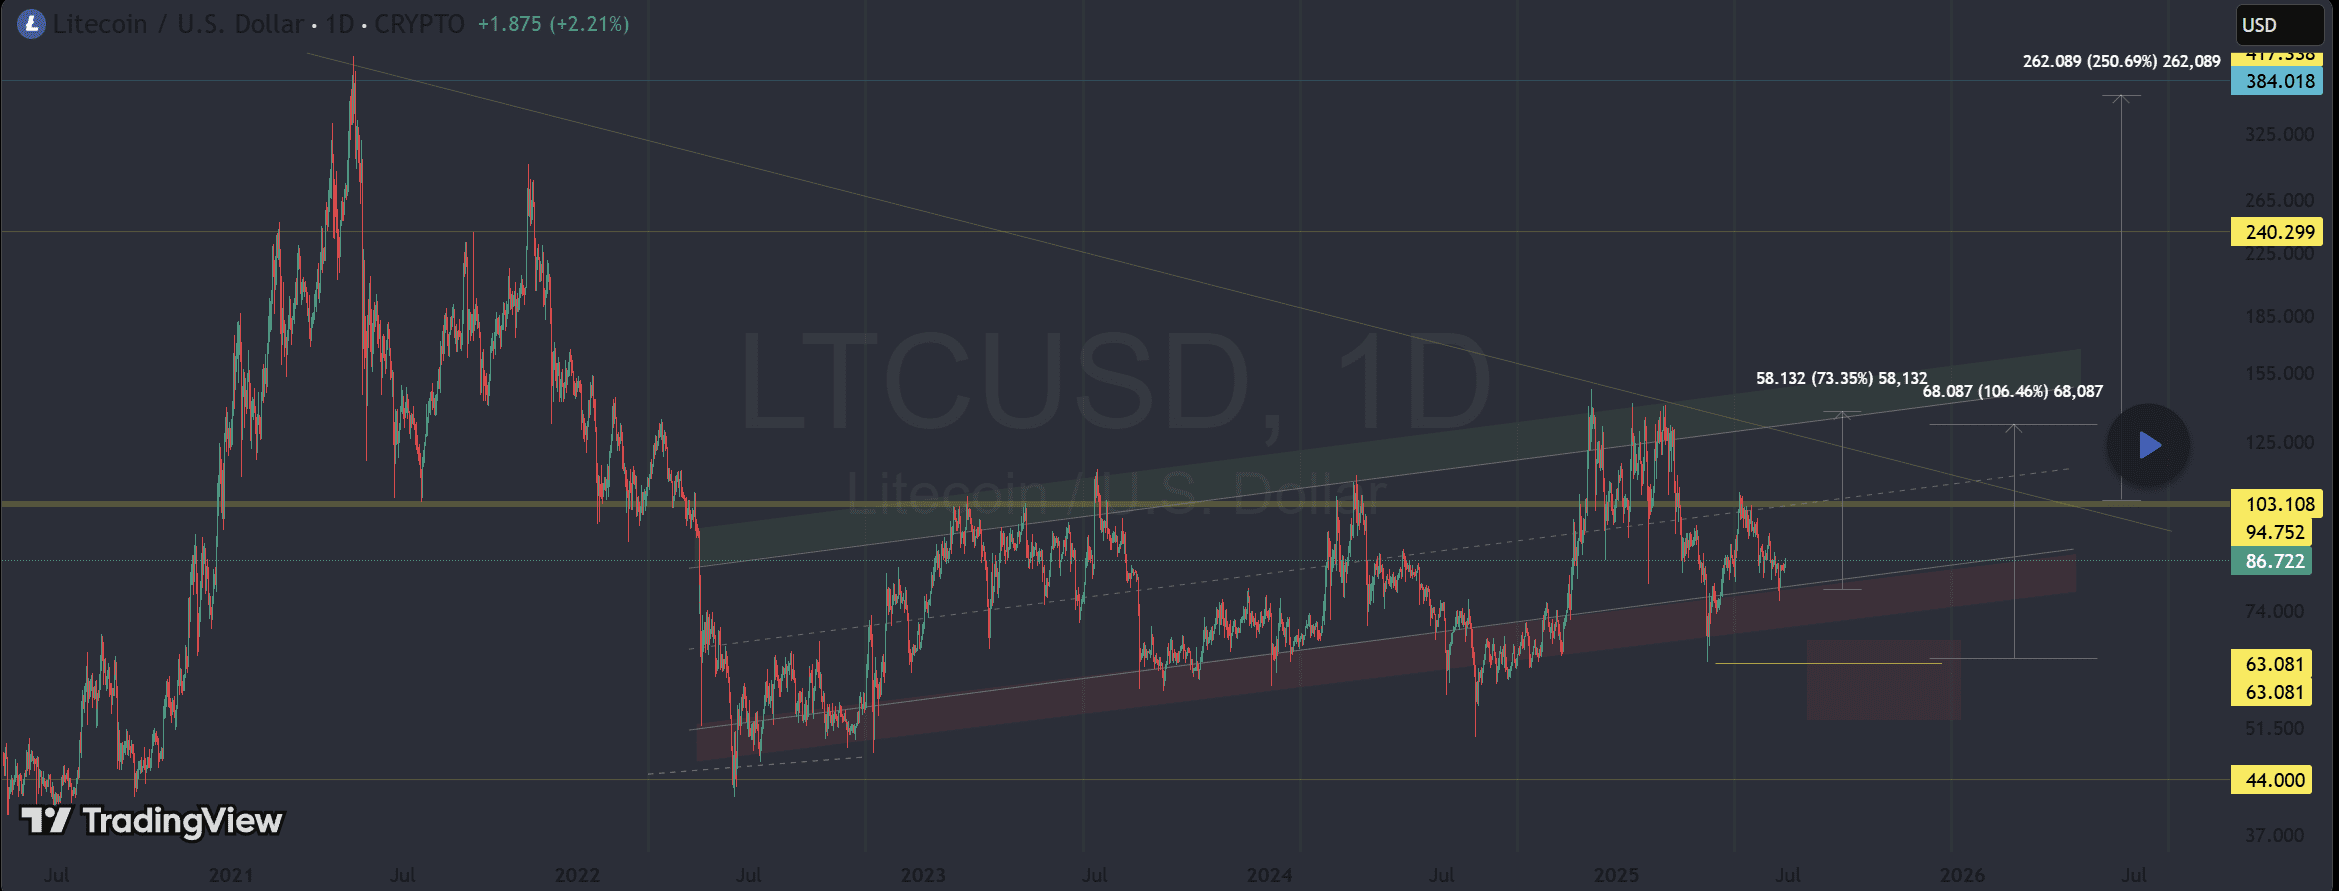
The trader’s plan favored scaling into positions rather than exiting, reflecting conviction that Litecoin’s correction formed a base, not a breakdown.
Litecoin Price Holds Steady Post Crash
Litecoin’s price structure held steady after its sharp mid-October crash, showing early signs of stabilization across key technical zones. The token hovered near $99, following a recovery later in the day. The retracement from $130 underscored market exhaustion, yet the rebound from the $88 region hinted at renewed accumulation interest.
The 0.382 Fibonacci level near $88.9 acts as the first crucial support, absorbing sell pressure during the volatile reversal. Sustaining this level was critical, as it marked the midpoint of Litecoin’s recovery channel since early April.
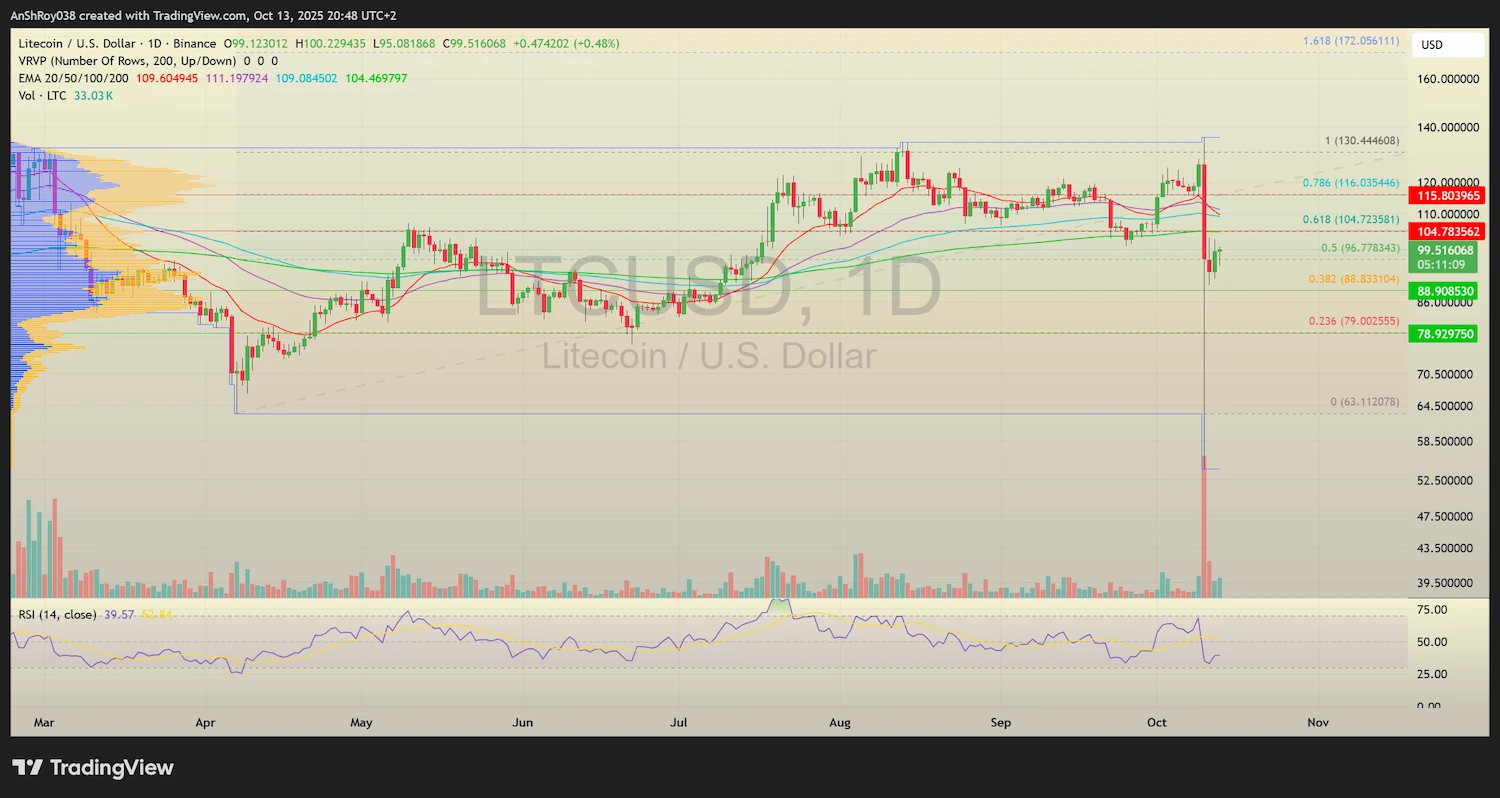
Below it, the next significant cushion rested near $79, where historical demand reemerged in previous pullbacks. A breakdown below this threshold would have reopened the path toward deeper downside correction.
On the upside, the LTC USD pair faces immediate resistance around $104, where the 0.618 retracement converged with the 200-day exponential moving average. Above it, the 0.786 level near $115.8 forms the final resistance before the broader structural ceiling near $130. Crossing this range would signal a potential shift toward a sustained uptrend.
The RSI hovered near the neutral 40–45 range, showing room for recovery without signaling overextension. Meanwhile, volume distribution confirmed dense participation in the $90–$100 band, suggesting a strong base formation. The broader setup pointed to consolidation before a directional breakout, with the outlined resistance and support levels likely dictating Litecoin’s trajectory in the sessions ahead.
Disclaimer: The analysis above reflects the author’s personal market views and is provided for informational purposes only. It should not be considered financial or investment advice. Readers must conduct their own research, or consult a licensed adviser, before making investment decisions. Any losses incurred from acting on this analysis will not be the responsibility of the author or CoinChapter in any way.