
Litecoin’s U.S. spot ETF, listed as LTCC on Nasdaq, traded about 486,000 today, according to crypto ETF flow trackers. The number shows a clear pullback from launch interest two days earlier, when the product attracted more than 1 million in turnover. Today’s print puts LTCC in the low-liquidity group among the new altcoin ETFs, behind Solana products that continue to lead daily volume.
The ETF arrived in a week of heavy headline traffic across digital assets, so part of the decline reflects simple attention drift. Traders rotated to more liquid Solana exposure, especially BSOL, which still commands the biggest tape among the new listings. Litecoin did not receive the same secondary-market support and so slid into normal, modest flow levels after the listing day.
The product structure did not change. LTCC remains a spot, single-asset fund tracking Litecoin, listed on Nasdaq, and positioned for U.S. investors who prefer brokerage access over exchange custody. But price discovery now depends on whether market makers see enough two-way interest to tighten spreads on quiet days.
Launch Spike vs. Post-Listing Reality
On October 28, when the Solana (BSOL), Hedera (HBR) and Litecoin (LTCC) spot ETFs listed together, the three products generated roughly $67–68 million in combined first-day trading, according to exchange and ETF-flow dashboards. Almost the entire tally came from Bitwise’s Solana ETF, which printed about $55–56 million, and from Canary’s Hedera ETF, which cleared about $8 million. Litecoin’s LTCC did about $1.38 million on the same day, leaving it well behind Solana and setting a lower base for later sessions.
By today, the market reverted to size. A fall from 1.38 million to around 486,000 signals that the opening flow was event-driven, not sustained demand. Funds often see this pattern when the underlying coin is not in a momentum phase and when there is no parallel options or futures activity to pull volume through the ETF. Litecoin cash markets also did not stage a rally that could have dragged ETF trading higher.
This cooling is not unique to Litecoin. Most single-asset altcoin ETFs in the U.S. settle into sub-million daily ranges after the listing wave passes, unless a macro or regulatory catalyst hits in the same week. For LTCC, that catalyst did not arrive today, so the product traded in line with its size and profile.
Trump–Xi Trade Optics And ETF Flows
The session unfolded while markets tracked the Trump–Xi trade talks, which already influenced Bitcoin ETF flows earlier this week when outflows from U.S. spot BTC products spiked alongside the Fed rate cut. Macro traders watched whether the U.S.–China tone would stay constructive or turn protectionist because either outcome can shift dollar liquidity and risk appetite. On days like that, marginal products such as the Litecoin ETF usually get less attention.

If the Trump–Xi channel delivers a softer line on tech and payments, high-beta crypto ETFs tend to benefit first, and Solana or broader-basket funds capture the bid before niche single-coin names. That hierarchy left LTCC waiting for secondary demand. Traders chose instruments with deeper order books in case headlines out of the talks moved the dollar or equities intraday.
So, Litecoin’s ETF did not fail; it traded as a small product in a headline-heavy session. With political news, Fed policy, and China all in the frame, liquidity concentrated where traders could exit fast. Today, that was not LTCC.
Litecoin Forms Rising Wedge On 4h Chart — Oct 30, 2025
Litecoin traded near 97.6 dollars on Oct 30, 2025, on the 4 hour Coinbase chart, after climbing along an ascending support line toward horizontal resistance around 101–102 dollars. The structure on the chart is a rising wedge that started after the sharp Oct 10 selloff and the fast recovery that followed. Price tested the upper purple line several times, but each bounce showed weaker candles while volume stayed flat to lower. A rising wedge is a pattern where price makes higher lows into nearly flat resistance, but buyers lose momentum and risk a downside break.
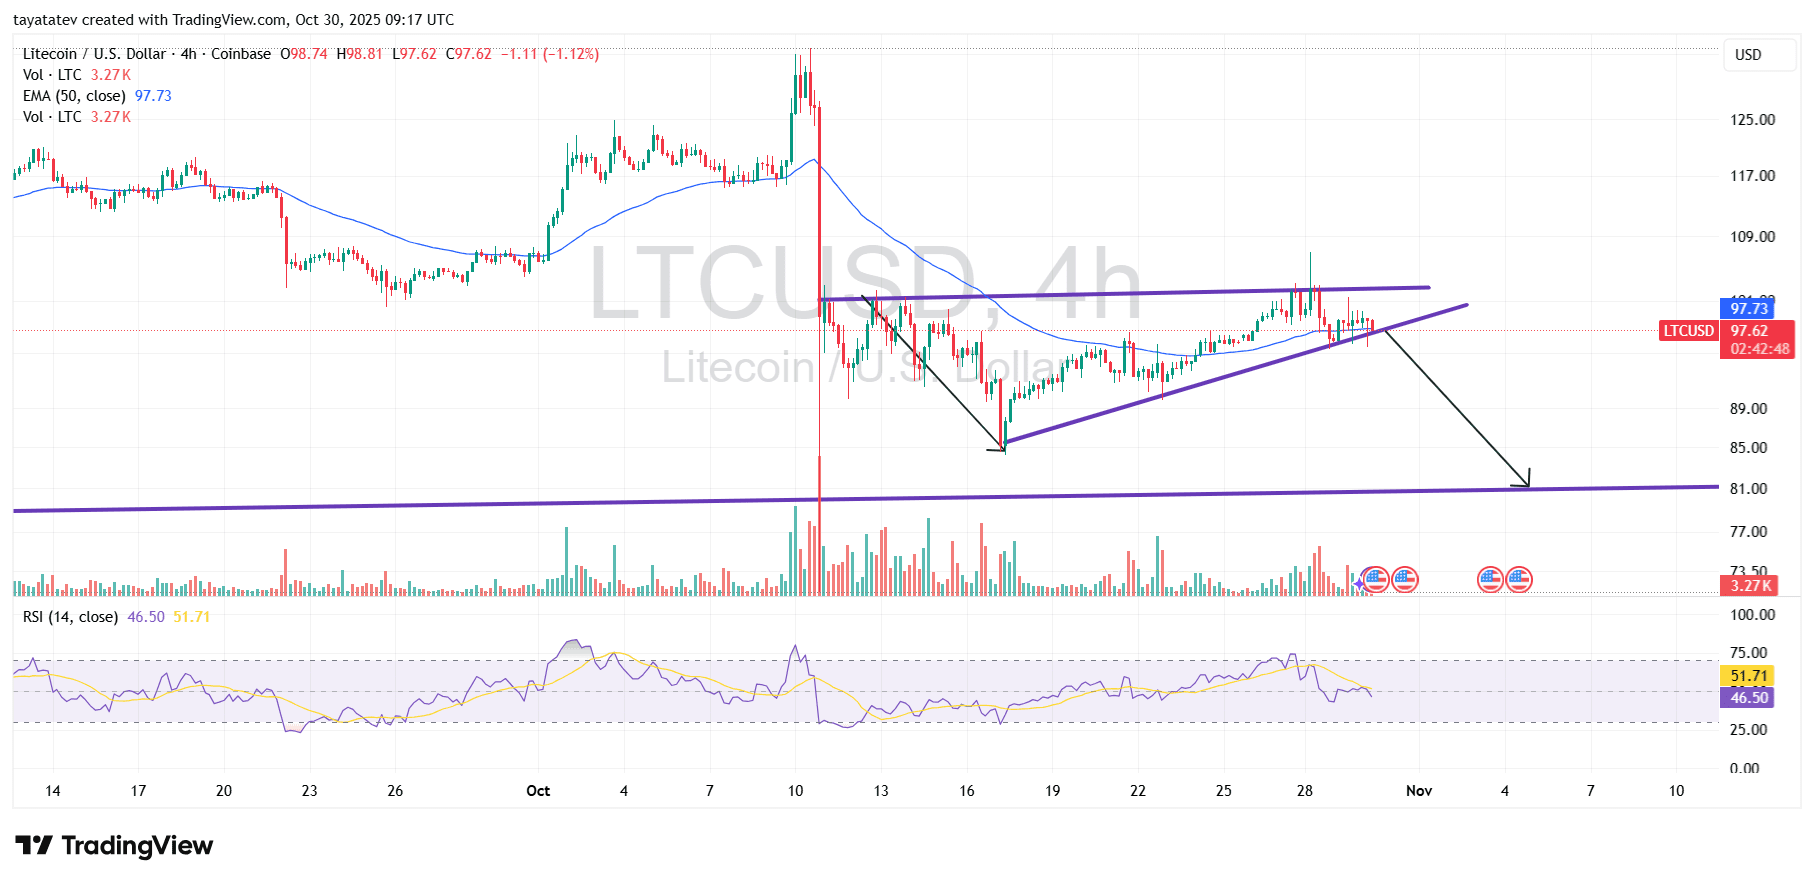
The wedge sits under the 50 EMA, now around 97.7 dollars, so bulls are already fighting the moving average from below. The lower purple trendline has three clean touches — Oct 16, Oct 22, and Oct 28 — so if the next 4h candle closes under that line with real volume, the pattern is confirmed. The chart also shows RSI rolling down from overbought toward the 40–45 zone, which matches a loss of momentum, not a new impulse higher.
If the wedge confirms, the measured move points down. A 20 percent drop from today’s 97.6 dollars projects to about 78–79 dollars, which aligns with the thick horizontal support drawn near 81 dollars on the chart. That zone is the logical destination because it capped trading earlier in October and because it stands well below the wedge, giving room for a flush before buyers return. So, the setup today is simple: hold the wedge and Litecoin can keep ranging under 102 dollars; break it, and the market can send LTC toward 81 dollars, with overshoot possible to about 78 dollars.