

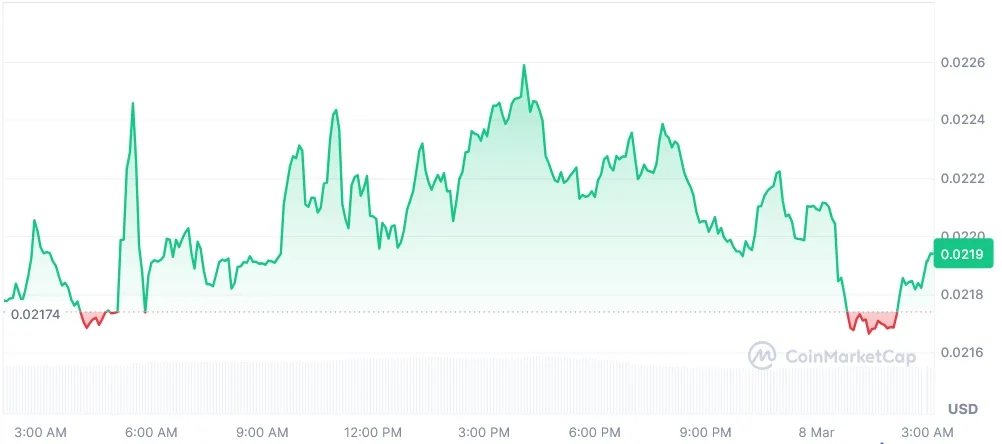
Monad (MON) posted a 4.47% weekly gain as the token stabilized near $0.02186 on Sunday, signaling improving market sentiment. The asset remained mostly stable over the past 24 hours while traders closely watched key support zones.
At the time of writing, MON is trading at $0.02186 with a 24-hour trading volume of $41.81 million, according to CoinMarketCap market data.
Trading volume declined by 3.07% during the same period. Meanwhile, the token’s market capitalization stands at $236.84 million, remaining relatively stable as broader crypto market participation gradually improves.
The move comes as traders monitor technical signals showing early signs of consolidation after the token recently broke out of a short-term downward structure.
Also Read: Bitcoin Whales Holdings Hit 9-Month Low as BTC Slides
MON Breaks Trendline, Builds Support Near $0.020
According to crypto analyst Sjuul | AltCryptoGems, the MON 4H chart shows a clear downtrend that respects a descending trendline and features multiple lower highs.
Price eventually broke this trendline and started consolidating in a sideways range. Strong support is near $0.019-$0.020, while deeper liquidity and major support lie around $0.017–$0.0165. After several liquidity injections at the lows, the market formed a triple bottom formation.
This is an accumulation pattern. It suggests that the selling pressure is diminishing, while buying is building up. It appears as though the market is consolidating before it starts moving up to new resistance.
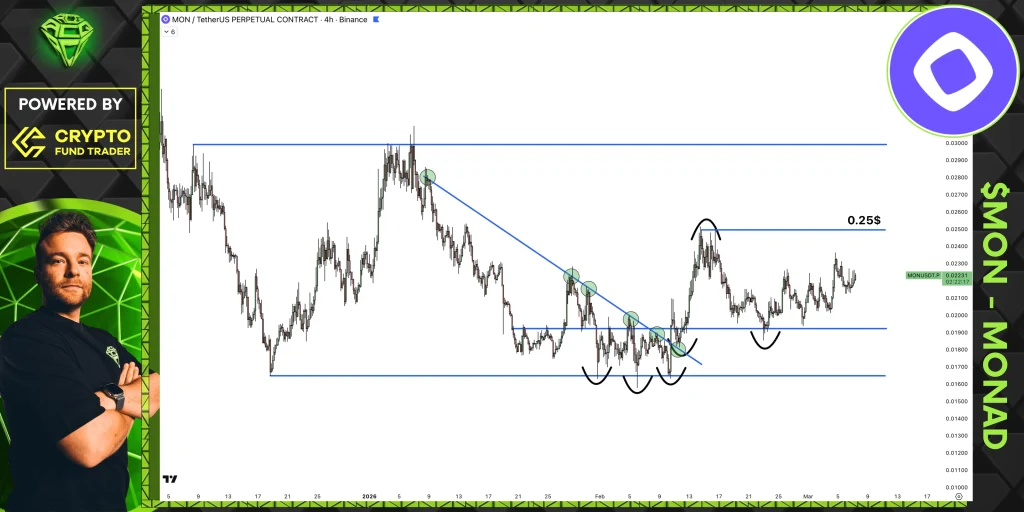
If the bullish wave continues to hold, as the wave pattern suggests, then the next price ceilings will be at $0.025, $0.027, and $0.029-$0.030.
However, as the price falls below $0.019, the price path will be downwards at $0.018, $0.017, and $0.0165, where strong demand and liquidity have
RSI 54.05 And MACD Signal Bullish
Momentum indicators also reflect a gradual shift towards bullish territory. On the daily chart, the RSI is resting just above 54.05, with its moving average resting just above 51.36, nudging the momentum gauge into a slightly bullish position. Although it is resting above the midpoint of 50, it is still far from being overbought at 70.
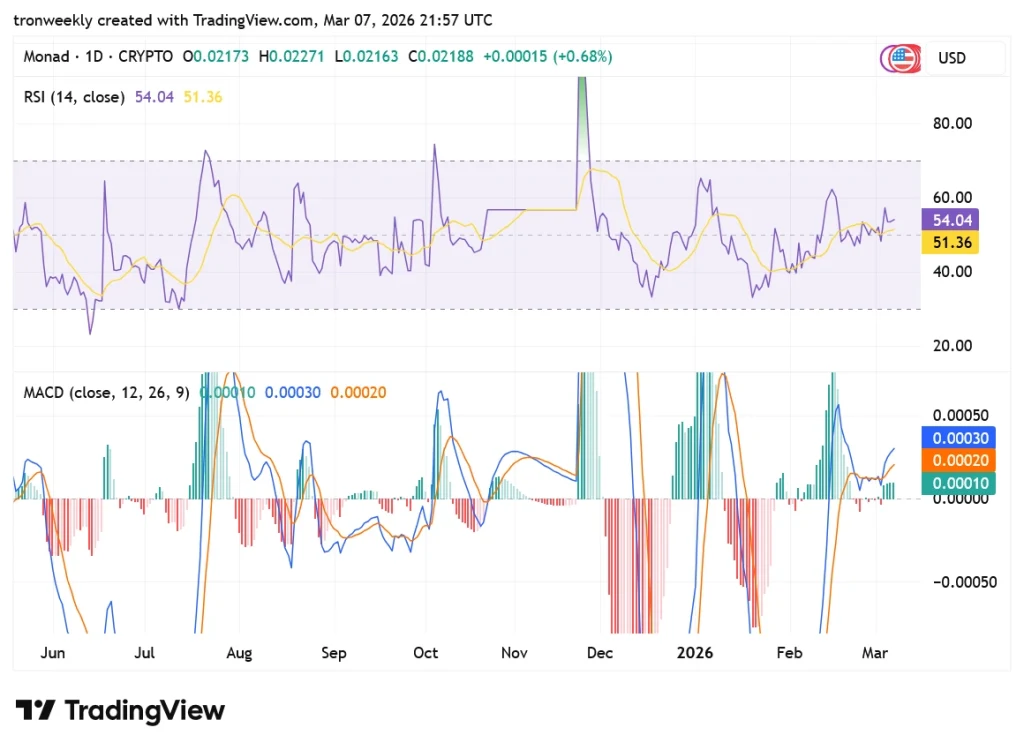
The MACD indicator is indicating a bullish signal since the line is at 0.00030, slightly above the signal line, which is around 0.0002. The histogram is at 0.00010. This gap indicates increasing momentum, suggesting a continued rise. However, the rise is not explosive.
Why This Matters
Having a solid base above $0.020 will pave the way for MON to rise towards the resistance zone of $0.025 to $0.030 in the near future.
The current levels of RSI and MACD indicate strong bullish indicators, suggesting possible investment opportunities for short-term investors.
Also Read: Monex Group Highlights XRP and SOL Strategy for 2026