

Notcoin (NOT) has confirmed a significant upside breakout above a major trend line on the 4-hour timeframe, signaling a potential shift in short-term market momentum.
According to the crypto analyst Clifton Fx, the breakout suggests buyers have overcome a key resistance level that previously limited price growth, increasing optimism among traders who are now closely watching for continued bullish movement.
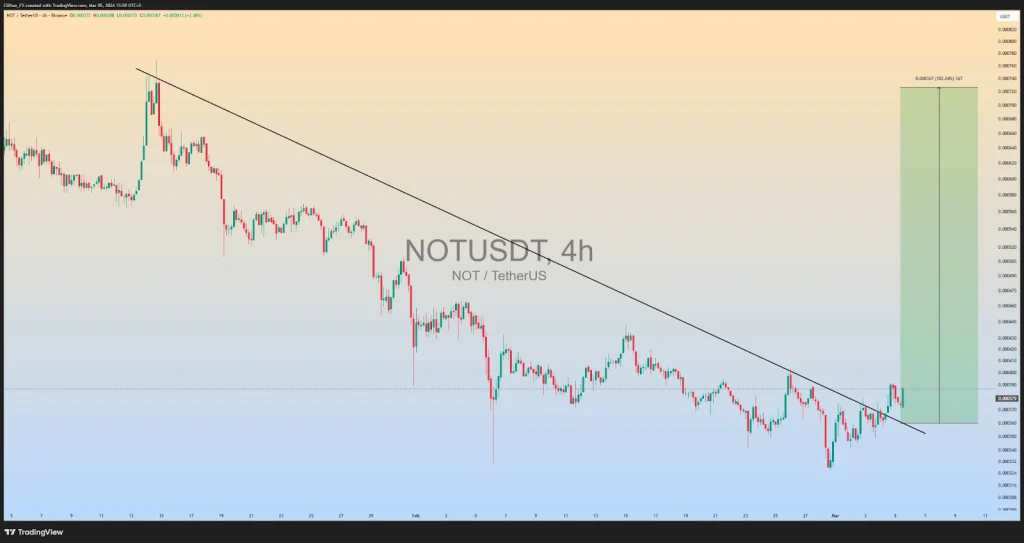
Source: Clifton Fx X Post
With the breakout now confirmed, analysts believe $NOT could be preparing for a strong upward rally if buying pressure remains steady.
Market watchers are highlighting $0.00073 as the next potential target, a level that could be reached if the token maintains support above the former resistance and bullish sentiment continues strengthening.
Also Read: Notcoin Price Analysis: NOT Targets $0.004937 Amid Bearish Market Pressure
Notcoin (NOT) Price Faces Pressure Below Key EMAs
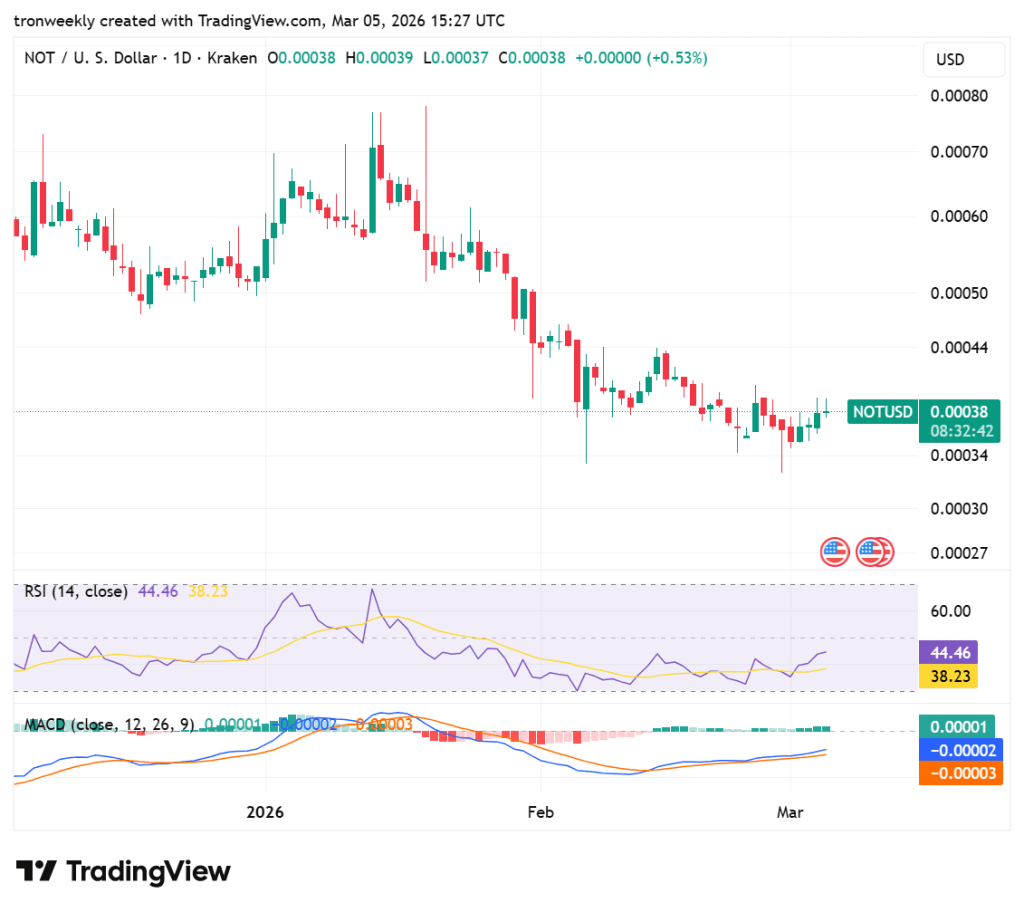
According to TradingView, NOT shows a persistent bearish trend with price action compressed near $0.00038. Trading well below major EMAs and the descending resistance line, the asset faces significant downward pressure.
Recent candle wicks indicate failed recovery attempts, leaving the market in a fragile sideways crawl as it tests psychological support floors established throughout early 2026.

Source: TradingView
The technical indicators also show that the outlook is heavily suppressed, as the price has to overcome the strong resistance of the red Ichimoku Cloud to move forward.
The 200-day EMA at $0.00089 is still out of reach, as the price has to overcome the 20-day EMA first. The price has to break through the current diagonal trendline to move out of the Ichimoku Cloud.
Momentum Indicators Point to Early Stabilization
The RSI (14) is seen at 44.46, rising above its yellow signal line, which is positioned at 38.23. This shows a move away from oversold territory and into a neutral zone.
Although still holding below the 50-level, confirming a bearish bias, the rising trend shows that buying pressure is building up as the price tries to recover from its recent lows.
Source: TradingView
The MACD indicates a bullish crossover since the blue line rises above the orange signal line. This is supported by the color change in the histogram to green from red, which indicates that the price has lost its falling momentum.
Although the two lines are still below the zero-median line, it indicates a short-term price recovery or reversal in trend.
Also Read: Notcoin (NOT) Tests Resistance: Will Bullish Breakout Drive the Prices to $0.00065?