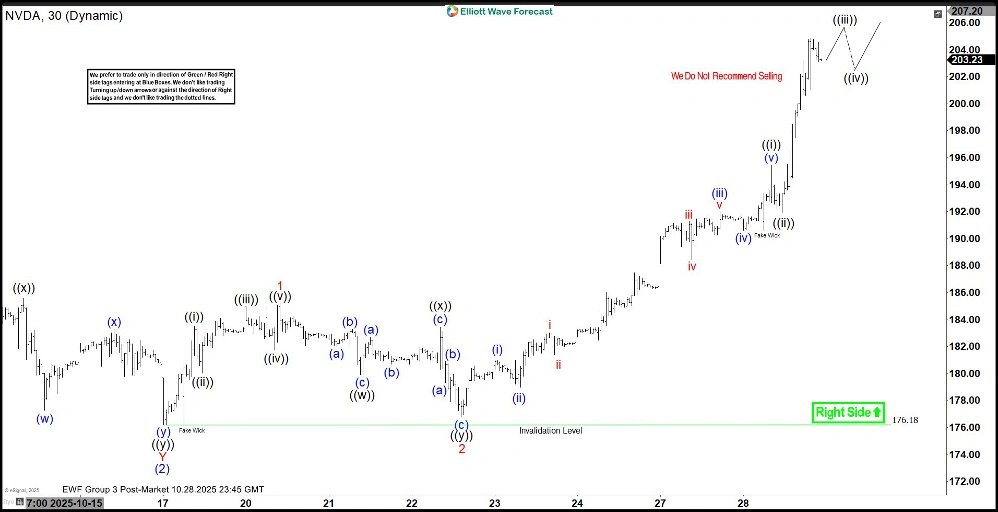
Nvidia (NVDA) continues its impulsive cycle from the April 2025 low, manifesting a clear five-wave advance. The stock now progresses through the terminal wave ((5)), which subdivides into a nested five-wave structure of lesser degree. The advance originated at the wave ((4)) low of $164.07, where wave (1) rallied to $195.62. A subsequent correction in wave (2) concluded at $176.18, as evidenced by the 30-minute chart. From this point, wave (3) resumed the upward trajectory.
Within wave (3), wave 1 terminated at $185.20, followed by a retracement in wave 2 to $176.76. The rally then accelerated in wave 3. From the wave 2 low, wave ((i)) completed at $195.47, and wave ((ii)) found support at $191.91. The structure projects further extension in wave ((iii)), followed by a consolidation in wave ((iv)) before the final push in wave ((v)) of 3. This internal progression supports a series of higher highs, continuing until wave (5) of ((5)) reaches completion and concludes the cycle from April 2025.
Near-term support remains firmly established at the $176.18 pivot low. As long as this level holds, any corrective dips—typically unfolding in three, seven, or eleven swings—should attract buyers and set the stage for additional upside. The overall impulsive framework remains intact, with bullish momentum driving the advance in accordance with Elliott Wave principles.
Nvidia (NVDA) latest 30-minutes Elliott Wave chart from 10.27.2025

