

Pi Network (PI) has surged more than 60% since the initial entry point, drawing strong attention from crypto traders and market analysts.
According to the crypto analyst Captain Faibik, as of Saturday, March 7, the rally reflects growing bullish momentum as the token pushed above key resistance levels.
Increased buying pressure and improving sentiment across the crypto market have supported the upward move, signaling renewed confidence among investors.

Source: Captain Faibik’s X Post
Market watchers say the next critical step is whether the token can maintain its breakout strength. If the price continues holding above support with strong volume, analysts believe the token could extend its rally toward the psychological $1 target. However, traders remain cautious as crypto markets are volatile and short-term pullbacks remain possible.
Also Read: Pi Network Targets $0.212 as Bullish Setup Emerges
PI Technical Outlook Shows Upward Potential
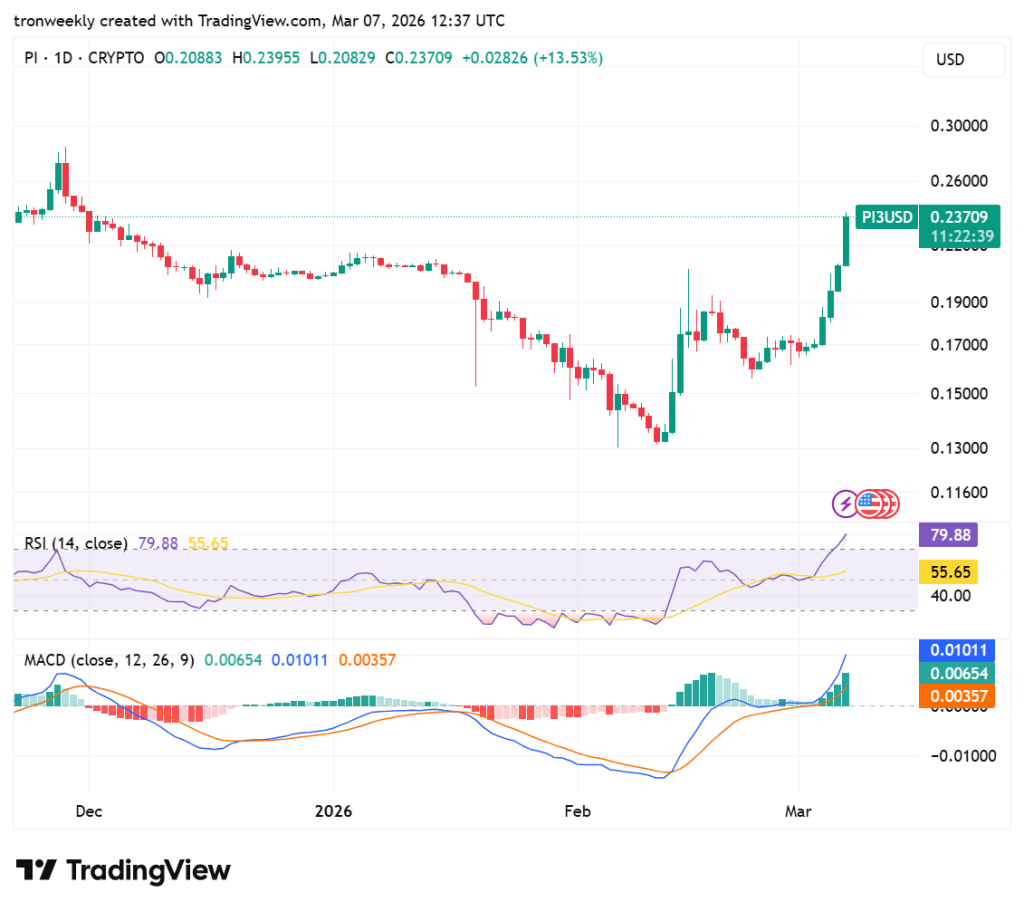
According to TradingView, as of Saturday, March 7, PI has demonstrated a strong bullish breakout, as the price has jumped by over 13% to reach 0.23749.
This strong price action has managed to rise above the Ichimoku Cloud and the 20, 50, and 100-day EMAs. This is a strong indication of a change in market sentiment, as the price has managed to rise above strong technical barriers.

Source: TradingView
However, the underlying pressure remains from the 200-day EMA at 0.28669. While the current run-up is certainly a strong move, the price still needs to consolidate above 0.21000 to validate the reversal.
The RSI should also be watched for overbought conditions, as a pullback to retest the broken EMAs could be seen before any further run towards the new target.
Momentum Indicators Reinforce Bullish Reversal
As the RSI indicator is currently at 79.88, the asset is well within the overbought region. This indicates that although the momentum is exceptionally high, the price may be overextended.
Traders often consider this a signal that the asset may be due for a pullback as the RSI indicator attempts to reach its midpoint.
Source: TradingView
The MACD continues to show the bullish trend, with the blue line shooting up significantly higher than the orange line. The bullish signal, together with the increasing size of the green bars, suggests that the buying pressure is building up. Yet, the sharp vertical climb is similar to the RSI, suggesting a sharp increase in the volatility of the PI.
Also Read: Pi Network (PI) Breaks Falling Wedge as Bulls Target $0.20 Resistance